


Model evaluation is a very important part of deep learning and machine learning, used to measure the performance and effect of the model. This article will break down the confusion matrix, accuracy, precision, recall and F1 score step by step
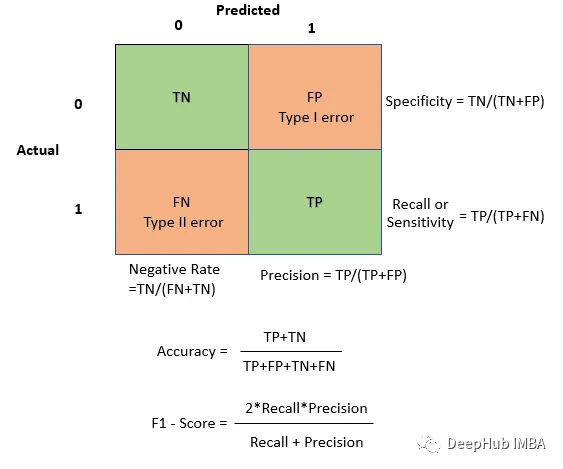
The confusion matrix is used to evaluate the performance of the model in classification problems. It is a table showing how the model classifies samples. Rows represent actual categories and columns represent predicted categories. For a two-classification problem, the structure of the confusion matrix is as follows:
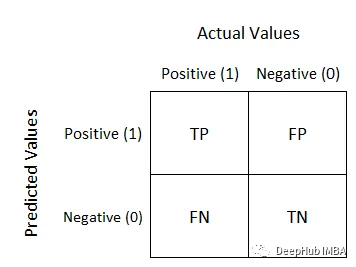
from sklearn.metrics import confusion_matrix import seaborn as sns import matplotlib.pyplot as plt # Example predictions and true labels y_true = [1, 0, 1, 1, 0, 1, 0, 0, 1, 0] y_pred = [1, 0, 1, 0, 0, 1, 0, 1, 1, 1] # Create a confusion matrix cm = confusion_matrix(y_true, y_pred) # Visualize the blueprint sns.heatmap(cm, annot=True, fmt="d", cmap="Blues", xticklabels=["Predicted 0", "Predicted 1"], yticklabels=["Actual 0", "Actual 1"]) plt.xlabel("Predicted") plt.ylabel("Actual") plt.show()Use TP and TN when you want to emphasize correct predictions and overall accuracy. Use FP and FN when you want to understand the types of errors your model makes. For example, in applications where the cost of false positives is high, minimizing false positives may be critical.
As an example, let’s talk about spam classifiers. The confusion matrix helps us understand how many spam emails the classifier correctly identified and how many non-spam emails it incorrectly marked as spam
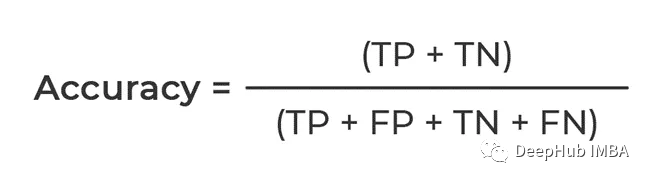
Based on the confusion matrix, many other emails can be calculated Evaluation metrics such as accuracy, precision, recall and F1 score.
Precision
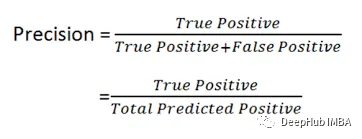 # #You can see the formula. It calculates the proportion of Positive, that is to say, how many Positives in the data are correctly predicted, so Precision is also called the accuracy rate
This becomes important in situations where false positives have significant consequences or costs. Taking the medical diagnosis model as an example, the accuracy is ensured to ensure that only those who really need treatment receive treatment
Recall
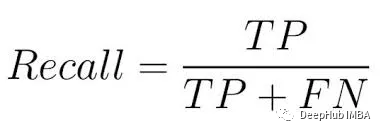 As can be seen from the formula, its main The purpose is to calculate the number of actual positive examples captured by the model, that is, the proportion of positive examples. Therefore, Recall is also called recall rate
F1 Score
# #F1 score is important because it provides a trade-off between precision and recall. When you want to find a balance between precision and recall, or for general applications, you can use F1 Score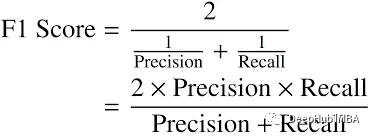
In this article, we introduced the confusion matrix, accuracy, precision, recall and F1 score in detail, and pointed out that these indicators can effectively evaluate and Improve model performance
The above is the detailed content of Read the classification model evaluation indicators in one article. For more information, please follow other related articles on the PHP Chinese website!
 What is Avalanche
 How to crack zip file encryption
 bootmgr is missing and cannot boot
 Database vulnerability repair methods
 How to use the notnull annotation
 Why the computer keeps restarting automatically
 How to watch live broadcast playback records on Douyin
 Which brand does OnePlus mobile phone belong to?


![[Web front-end] Node.js quick start](https://img.php.cn/upload/course/000/000/067/662b5d34ba7c0227.png)


