


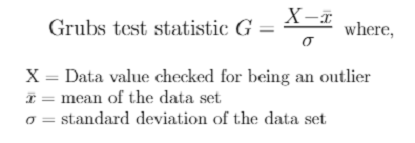
How to perform Grubbs test in Python

Introduction
The Grubbs test is a statistical hypothesis testing method used to detect outliers in a data set. Outliers are observations that are assigned to a data distribution, also known as anomalies. Data sets with outliers tend to be more susceptible to overfitting than data with a normal/Gaussian distribution. Therefore, it is necessary to address outliers before machine learning modeling. Before processing, we must detect and locate outliers in the data set. The most popular outlier detection techniques are QQPlot, interquartile range, and Grubbs statistical test. However, this article will only discuss the Grubbs test for detecting outliers. You will learn: What is a Grubbs test and how to implement it in Python.
What is an outlier?
Outliers are data observations that are numerically far apart from other data values. These values are outside the range of normally distributed data. The data set must contain 67% of the records at the first standard deviation, 95% of the data at the second standard deviation, and 99.7% of the points at the third standard deviation to achieve a normal distribution. In other words, the data points should lie between the first and third quartile range. We consider records below the first quartile and above the third quartile as outliers or outliers.
Grabbs Statistical Hypothesis Test
Like any other statistical hypothesis test, the Grubbs test can also approve or reject the null hypothesis (H0) or the alternative hypothesis (H1). The Grubbs test is a test that detects outliers in a data set.
We can perform the Grubbs test in two ways: One-sided test and Two-sided test , for univariate data sets or nearly normal samples with at least seven distribution of variables. This test is also called the extreme studentized deviation test or the maximum normalized residual test.
The Grubbs test uses the following assumptions -
Null (H0): The data set has no outliers.
Alternative (H1): The data set has only one outlier.
Grabbs Test in Python
Python can handle any programming challenge with its vast collection of libraries. These libraries provide built-in methods that can be used directly to perform any operation, statistical testing, etc. Likewise, Python has a library that contains methods for performing Grubbs tests to detect outliers. However, we will explore two ways to implement Grubbs tests in Python: built-in functions in libraries and implementing formulas from scratch.
Outlier Library and Smirnov_grubbs
Let us first install the outlier_utils library using the following command.
!pip install outlier_utils
Now let's make a dataset containing outliers and perform a Grubbs test.
Double-sided Grubb Test
grammar
grubbs.test(data, alpha=.05)
parameter
data - Numeric vector of data values.
alpha - The significance level of the test.
illustrate
In this method, the user must use the smirnov_grubbs.test() function from the outlier package and pass the necessary data as input in order to run Grubb's tests.
Example
import numpy as np
from outliers import smirnov_grubbs as grubbs

#define data
data = np.array([ 5, 14, 15, 15, 14, 19, 17, 16, 20, 22, 8, 21, 28, 11, 9, 29, 40])

#perform Grubbs' test
grubbs.test(data, alpha=.05)
Output
array([ 5, 14, 15, 15, 14, 19, 17, 16, 20, 22, 8, 21, 28, 11, 9, 29])
The above code just starts by loading the library and data, and finally uses the "test" method to perform a Grubbs test on this data. This test detects outliers on both sides (left and right), or values below the first quartile and above the third quartile. The data had only 1 outlier (40), which was removed using Grubbs' test.
One-sided Grubbs test
Synatx
grubbs.max_test(data, alpha=.05)
illustrate
In this method, the user must call the grubbs.min_test() function to obtain the minimum outlier value from the provided data set, or call the grubbs.max_test() function to obtain the minimum outlier value from the provided data set Get the largest outlier in the data set to obtain a one-sided Grubb's test.
Example
import numpy as np
from outliers import smirnov_grubbs as grubbs

#define data
data = np.array([5, 14, 15, 15, 14, 19, 17, 16, 20, 22, 8, 21, 28, 11, 9, 29, 40])

#perform Grubbs' test for minimum value is an outlier
print(grubbs.min_test(data, alpha=.05))

#perform Grubbs' test for minimum value is an outlier
grubbs.max_test(data, alpha=.05)
Output
[ 5 14 15 15 14 19 17 16 20 22  8 21 28 11  9 29 40]
array([ 5, 14, 15, 15, 14, 19, 17, 16, 20, 22,  8, 21, 28, 11,  9, 29])
One-sided Grubbs test detects outliers below the first quartile or above the third quartile. We can see that the min_test method removes outliers from the smallest side of the data, while the max_test method removes outliers from the top of the data.
Formula implementation
Here we will use Python to implement the following Grubbs test formula. We will use the Numpy and Scipy libraries to achieve this.
grammar
g_calculated = numerator/sd_x
g_critical = ((n - 1) * np.sqrt(np.square(t_value_1))) / (np.sqrt(n) * np.sqrt(n - 2 + np.square(t_value_1)))
algorithm
The implementation steps are as follows -
Calculate the average of the data set values.
Calculate the standard deviation of the data set values.
To implement the Grubbs test formula, calculate the numerator by subtracting each value in the data set from its mean.
Divide the numerator value by the standard deviation to get the calculated score.
Calculate critical scores for the same value.
If the critical value is greater than the calculated value, there are no outliers in the data set, otherwise there are outliers.
Example
import numpy as np
import scipy.stats as stats
## define data
x = np.array([12,13,14,19,21,23])
y = np.array([12,13,14,19,21,23,45])

## implement Grubbs test
def grubbs_test(x):
   n = len(x)
   mean_x = np.mean(x)
   sd_x = np.std(x)
   numerator = max(abs(x-mean_x))
   g_calculated = numerator/sd_x
   print("Grubbs Calculated Value:",g_calculated)
   t_value_1 = stats.t.ppf(1 - 0.05 / (2 * n), n - 2)
   g_critical = ((n - 1) * np.sqrt(np.square(t_value_1))) / (np.sqrt(n) * np.sqrt(n - 2 + np.square(t_value_1)))
   print("Grubbs Critical Value:",g_critical)
   if g_critical > g_calculated:
      print("We can see from the Grubbs test that the calculated value is less than the crucial value. Recognize the null hypothesis and draw the conclusion that there are no outliers\n")
   else:
      print("We see from the Grubbs test that the estimated value exceeds the critical value. Reject the null theory and draw the conclusion that there are outliers\n")
grubbs_test(x)
grubbs_test(y)
Output
Grubbs Calculated Value: 1.4274928542926593
Grubbs Critical Value: 1.887145117792422
We can see from the Grubbs test that the calculated value is less than the crucial value. Recognize the null hypothesis and draw the conclusion that there are no outliers

Grubbs Calculated Value: 2.2765147221587774
Grubbs Critical Value: 2.019968507680656
We see from the Grubbs test that the estimated value exceeds the critical value. Reject the null theory and draw the conclusion that there are outliers
The result of the Grubb test shows that the array x does not have any outliers, but y has 1 outlier.
in conclusion
We learned about outliers and Grubbs tests in Python in this article. Let’s wrap up this article with some key points.
Outliers are records that fall outside the interquartile range.
Outliers do not conform to the normal distribution of the data set.
We can use the Grubbs hypothesis statistical test to detect outliers.
We can execute Grubbs tests using the built-in methods provided in the outlier_utils library.
The two-sided Grubbs test detects and removes outliers on the left and right sides.
However, the one-sided Grubbs test will detect outliers on either side.
The above is the detailed content of How to perform Grubbs test in Python. For more information, please follow other related articles on the PHP Chinese website!

Hot AI Tools

Undress AI Tool
Undress images for free

Undresser.AI Undress
AI-powered app for creating realistic nude photos

AI Clothes Remover
Online AI tool for removing clothes from photos.

Clothoff.io
AI clothes remover

Video Face Swap
Swap faces in any video effortlessly with our completely free AI face swap tool!

Hot Article
Hot Tools

Notepad++7.3.1
Easy-to-use and free code editor

SublimeText3 Chinese version
Chinese version, very easy to use

Zend Studio 13.0.1
Powerful PHP integrated development environment

Dreamweaver CS6
Visual web development tools

SublimeText3 Mac version
God-level code editing software (SublimeText3)


 Can a Python class have multiple constructors?
Jul 15, 2025 am 02:54 AM
Can a Python class have multiple constructors?
Jul 15, 2025 am 02:54 AM
Yes,aPythonclasscanhavemultipleconstructorsthroughalternativetechniques.1.Usedefaultargumentsinthe__init__methodtoallowflexibleinitializationwithvaryingnumbersofparameters.2.Defineclassmethodsasalternativeconstructorsforclearerandscalableobjectcreati
 Python for Quantum Machine Learning
Jul 21, 2025 am 02:48 AM
Python for Quantum Machine Learning
Jul 21, 2025 am 02:48 AM
To get started with quantum machine learning (QML), the preferred tool is Python, and libraries such as PennyLane, Qiskit, TensorFlowQuantum or PyTorchQuantum need to be installed; then familiarize yourself with the process by running examples, such as using PennyLane to build a quantum neural network; then implement the model according to the steps of data set preparation, data encoding, building parametric quantum circuits, classic optimizer training, etc.; in actual combat, you should avoid pursuing complex models from the beginning, paying attention to hardware limitations, adopting hybrid model structures, and continuously referring to the latest documents and official documents to follow up on development.
 python one line if else
Jul 15, 2025 am 01:38 AM
python one line if else
Jul 15, 2025 am 01:38 AM
Python's onelineifelse is a ternary operator, written as xifconditionelsey, which is used to simplify simple conditional judgment. It can be used for variable assignment, such as status="adult"ifage>=18else"minor"; it can also be used to directly return results in functions, such as defget_status(age):return"adult"ifage>=18else"minor"; although nested use is supported, such as result="A"i
 Completed python blockbuster online viewing entrance python free finished website collection
Jul 23, 2025 pm 12:36 PM
Completed python blockbuster online viewing entrance python free finished website collection
Jul 23, 2025 pm 12:36 PM
This article has selected several top Python "finished" project websites and high-level "blockbuster" learning resource portals for you. Whether you are looking for development inspiration, observing and learning master-level source code, or systematically improving your practical capabilities, these platforms are not to be missed and can help you grow into a Python master quickly.
 Accessing data from a web API in Python
Jul 16, 2025 am 04:52 AM
Accessing data from a web API in Python
Jul 16, 2025 am 04:52 AM
The key to using Python to call WebAPI to obtain data is to master the basic processes and common tools. 1. Using requests to initiate HTTP requests is the most direct way. Use the get method to obtain the response and use json() to parse the data; 2. For APIs that need authentication, you can add tokens or keys through headers; 3. You need to check the response status code, it is recommended to use response.raise_for_status() to automatically handle exceptions; 4. Facing the paging interface, you can request different pages in turn and add delays to avoid frequency limitations; 5. When processing the returned JSON data, you need to extract information according to the structure, and complex data can be converted to Data
 python run shell command example
Jul 26, 2025 am 07:50 AM
python run shell command example
Jul 26, 2025 am 07:50 AM
Use subprocess.run() to safely execute shell commands and capture output. It is recommended to pass parameters in lists to avoid injection risks; 2. When shell characteristics are required, you can set shell=True, but beware of command injection; 3. Use subprocess.Popen to realize real-time output processing; 4. Set check=True to throw exceptions when the command fails; 5. You can directly call chains to obtain output in a simple scenario; you should give priority to subprocess.run() in daily life to avoid using os.system() or deprecated modules. The above methods override the core usage of executing shell commands in Python.
 python if else example
Jul 15, 2025 am 02:55 AM
python if else example
Jul 15, 2025 am 02:55 AM
The key to writing Python's ifelse statements is to understand the logical structure and details. 1. The infrastructure is to execute a piece of code if conditions are established, otherwise the else part is executed, else is optional; 2. Multi-condition judgment is implemented with elif, and it is executed sequentially and stopped once it is met; 3. Nested if is used for further subdivision judgment, it is recommended not to exceed two layers; 4. A ternary expression can be used to replace simple ifelse in a simple scenario. Only by paying attention to indentation, conditional order and logical integrity can we write clear and stable judgment codes.
 python seaborn jointplot example
Jul 26, 2025 am 08:11 AM
python seaborn jointplot example
Jul 26, 2025 am 08:11 AM
Use Seaborn's jointplot to quickly visualize the relationship and distribution between two variables; 2. The basic scatter plot is implemented by sns.jointplot(data=tips,x="total_bill",y="tip",kind="scatter"), the center is a scatter plot, and the histogram is displayed on the upper and lower and right sides; 3. Add regression lines and density information to a kind="reg", and combine marginal_kws to set the edge plot style; 4. When the data volume is large, it is recommended to use "hex"
