1. Background
Application service monitoring is an important part of the intelligent operation and maintenance system. In the UAV system, the middleware enhancement framework (MOF) probe provides application portrait and performance data collection functions. The data collection function mainly collects four types of data: real-time data, portrait data, call link data generation and thread data analysis data. . In order to achieve real-time data collection, UAVStack designed the CaptureFramework framework to provide unified data capture behavior and the ability to generate capture results.
2. CaptureFramework operating principle
2.1 Key technical description
JavaAssist
Monitor capture system
precap/docap
##2.2 Architecture description
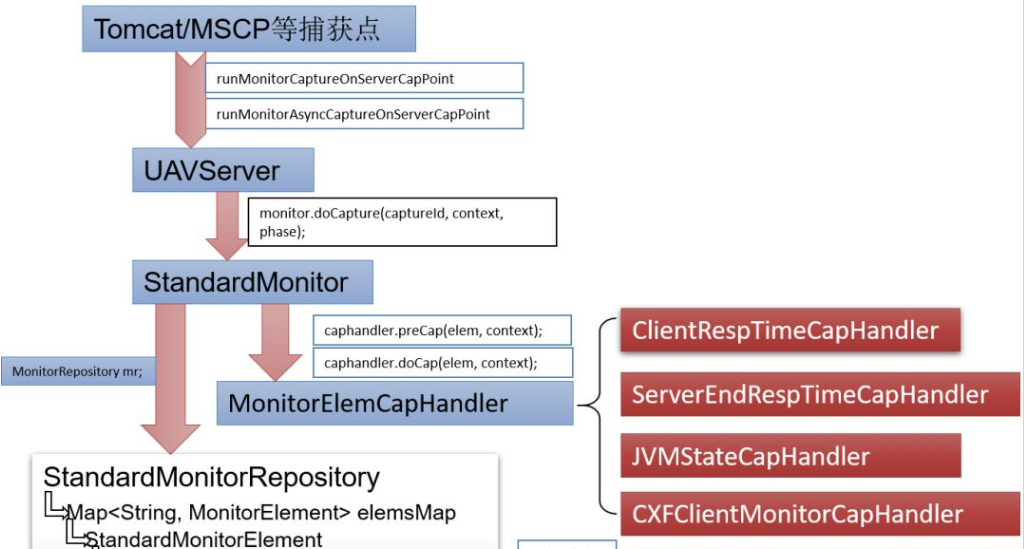
- Capture points: Supports Tomcat, MSCP, Springboot, and Jetty capture points.
- UAVServer singleton: As a unified capture entry point, it provides synchronous and asynchronous methods.
- StandardMonitor: It implements the Monitor interface and is a real-time data capture implementation class. It provides the doCapture method, which is responsible for the capture behavior and generating capture results.
- MonitorElemCapHandler: Different crawling logic and common interfaces of crawling points implement different burying logic, and provide methods of crawling behavior, preCap and doCap, and methods of generating crawling results. preStore.
- StandardMonitorRepository: Stores real-time data capture data structure.
- DataObserver: Exposes JMX/HTTP interface data.
2.3 Key Class Description
- Monitor real-time monitoring mainly starts from the DefaultMonitorSupporter class to initialize the StandardMonitor object, and installs the monitor object to the DataStore object through CaptureFramework middle.
- DataObserver provides JMX/HTTP service for subsequent MA crawling. The Http service has registered three handlers, namely HttpJEEJVMObserver, HttpJEEMonitorObserver, and HttpJEEProfileObserver. Different handlers expose different interfaces.
- The Handler class under the MonitorHandler package specifically handles the calculation and statistics of Monitor's indicator data.
2.4 Capture point analysis
The CaptureFrameWork framework provides a unified capture entry point, and provides synchronous methods and asynchronous methods in UAVServer:
- Synchronous capture entry point: runMonitorCaptureOnServerCapPoint
- Asynchronous capture entry point: runMonitorAsyncCaptureOnServerCapPoint
2.4.1 Synchronous and asynchronous calls Difference analysis
Asynchronous adds one more parameter than synchronization, CaptureContextMapFromAnotherThread. If this parameter is not empty, the context information needs to be merged. Under normal circumstances, when using an asynchronous method to bury the point, the CaptureContextMapFromAnotherThread passed in by calling the asynchronous capture method before the method is executed is empty, and the encapsulated context information is returned. After the method execution is completed, the asynchronous capture method is called to pass in the context information, and the Context information is merged, and then the specific capture operation is performed. For details, please refer to the following code snippet:
- Asynchronous call before method execution

##The asynchronous call after method execution is as follows, where ccMap is the encapsulated context information returned by the asynchronous call
 2.5 Analysis of grabbing behavior
Monitor interface: Provides multiple interfaces, the most important of which are the doCapture and doPreStore methods. doCapture is used to implement execution at a specific capture point. For the behavior of capturing data, the doPreStore method is used to implement some capturing actions before storing it in the data structure, and to do some special data processing.
 monitor.doCapture It calls doCapture in the Monitor interface, and its implementation class is StandardMonitor.
The doCapture method in StandardMonitor mainly does the following operations:
Get the current MonitorElement array according to the parameters. The MonitorElement array is implemented through getElementByCapId of StandardMonitorRepository; -
Loop through the MonitorElement array, obtain the capture data implementation class, obtain the current handler to be executed based on the implementation class, and finally determine the capture stage (precap/docap) based on the currently obtained handler, and then perform corresponding processing . Different handlers generate MonitorElementInstance based on different characteristics, and finally store the results in the StandardMonitorRepository data structure.
Take ServerEndRespTimeCapHandler (server-side crawling behavior) as an example:
preCap method: only records the start request time of the service.
doCap method: perform different logical processing according to different monitorElemId, and finally encapsulate the MonitorElementInstance instance, and then process the capture behavior results, including maximum value peak elimination, maximum value , minimum value, return status code, timestamp update, counting and other corresponding data processing.
3. Real-time data collection
3.1 What is real-time data
That is, runtime data, which refers to the information generated when the program is running. The CPU, heap memory, JVM information occupied by the program, and statistics related to service access and client calls (average response time, access count, etc.).
3.2 Server-side data collection
Implementation of DefaultMonitorSupporter
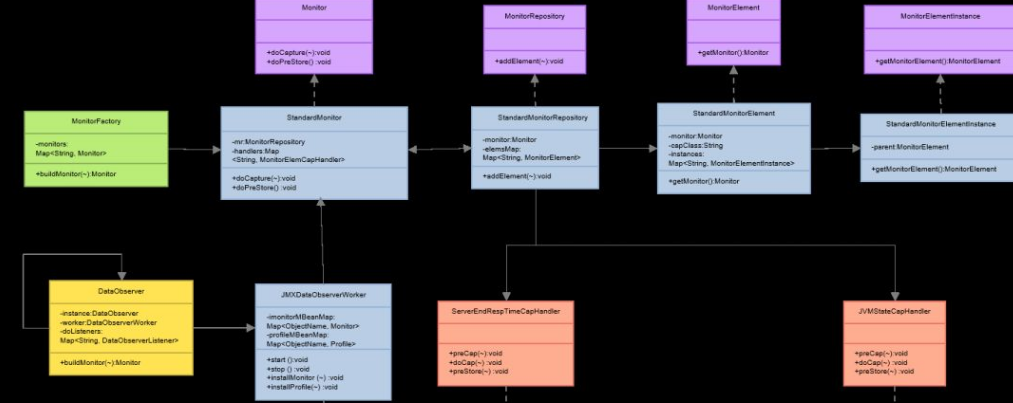
Server-side data collection uses DefaultMonitorSupporter.start as the entry point to build a monitor instance :

## By default, a StandardMonitor instance of the service type is built, which contains a StandardMonitorRepository instance. The StandardMonitorRepository instance registers a monitor. This instance contains multiple MonitorElement instances and saves all MonitorElement instances. in the elemsMap attribute.
elemsMap attribute saves different collection class handlers according to different collection objects:
- ServerEndRespTimeCapHandler: collects the response time and loading count of Server, APP, URL, etc.
- JVMStateCapHandler: Collects jvm status, including Heap usage, GC count, thread count, CPU, class count, etc.
The code snippet is as follows:

 ##3.3 Client data collection
Implementation of DefaultClientMonitorSupporter
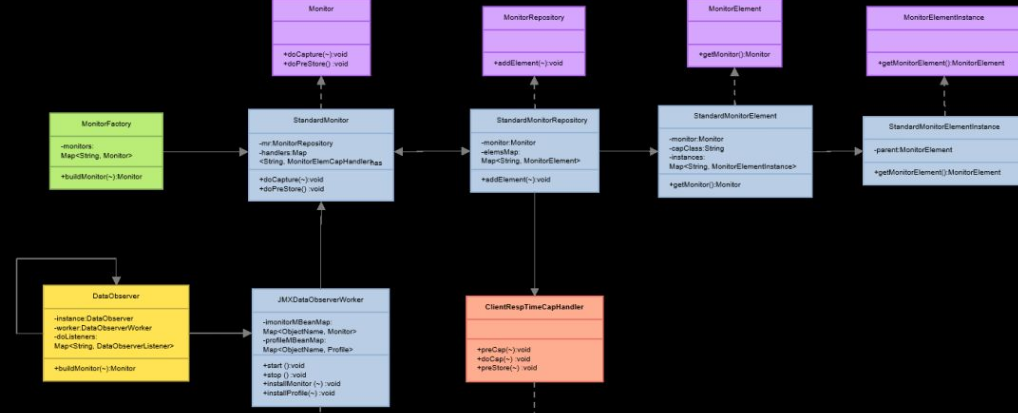 Client data collection uses DefaultClientMonitorSupporter.start as the entry point to build a monitor instance:
 Build the client type StandardMonitor by default Instance, which contains StandardMonitorRepository instance, StandardMonitorRepository instance registers monitor, one instance contains multiple MonitorElement instances, and saves all MonitorElement instances in the elemsMap attribute.
elemsMap: The property only saves one ClientRespTimeCapHandler collection class.
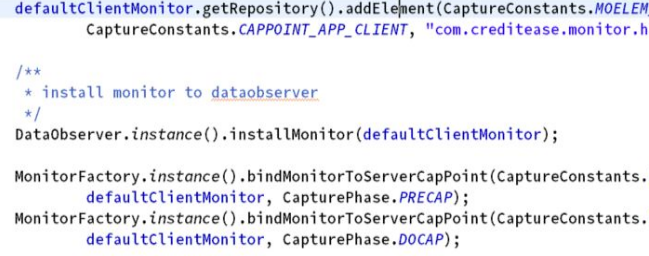 Whether it is client-side data collection or server-side data collection, the monitor will be installed into the DataObserver; and finally the successfully constructed monitor will be bound Set to the specified capture method (i.e. precap and docap).
3.4 Implementation of DataObServer
DataObServer provides two modes to expose interface data, namely JMX and HTTP:
HTTP mode: by HttpDataObserverWorker .start is used as the entry point, and three handlers are registered respectively, which are handlers for obtaining JVM data, Monitor data and profile data. Each handler exposes a unique interface, but they all return data in JSON format.
The above is the detailed content of How to perform CaptureFramework framework analysis. For more information, please follow other related articles on the PHP Chinese website!


 2.5 Analysis of grabbing behavior
 monitor.doCapture It calls doCapture in the Monitor interface, and its implementation class is StandardMonitor.


 ##3.3 Client data collection
 Client data collection uses DefaultClientMonitorSupporter.start as the entry point to build a monitor instance:
  Build the client type StandardMonitor by default Instance, which contains StandardMonitorRepository instance, StandardMonitorRepository instance registers monitor, one instance contains multiple MonitorElement instances, and saves all MonitorElement instances in the elemsMap attribute.
  Whether it is client-side data collection or server-side data collection, the monitor will be installed into the DataObserver; and finally the successfully constructed monitor will be bound Set to the specified capture method (i.e. precap and docap).


