
JPDA (Java Platform Debugger Architecture) is the abbreviation of Java Platform Debugger Architecture , through the API provided by JPDA, developers can easily and flexibly build Java debugging applications.
JPDA is mainly composed of three parts: Java Virtual Machine Tool Interface (JVMTI), Java Debug Wire Protocol (JDWP), and Java Debug Interface (JDI).
Java programs all run on the Java virtual machine. If we want to debug a Java program, we actually need to request the current running status from the Java virtual machine, issue certain instructions to the virtual machine, and set some Callbacks, etc., then the Java debugging system is a complete set of tools and interfaces for debugging of the virtual machine.
1: The editor acts as a client and server program to establish a socket connection through the exposed listening port
2: IDE client The breakpoint event is created at the breakpoint location and passed to the VM of the server (program) through the JDI interface. The VM calls suspend to suspend the VM
3: After the VM is suspended, the VM information that the client needs to obtain is Return to the client. After returning, the VM resume resumes its running state
4: After the client obtains the information returned by the VM, it can display it in different ways
JPDA defines a complete and independent system, which is composed of three relatively independent layers, and stipulates the interaction mode between them, or defines the interface for their communication.
The three levels from low to high are Java Virtual Machine Tool Interface (JVMTI), Java Debug Wire Protocol (JDWP) and Java Debug Interface (JDI).
These three modules decompose the debugging process into several natural concepts: debugger (debugger) and debugee (debuggee), as well as the communicator between them.
The debugee runs on the Java virtual machine we want to debug. It can monitor the information of the current virtual machine through the JVMTI standard interface; the debugger defines the debugging interfaces that users can use, through these interfaces , the user can send debugging commands to the debugged virtual machine, and the debugger accepts and displays the debugging results.
The JDWP communication protocol is used to transmit debugging commands and debugging results. It connects the debugger and the debugee during debugging. All commands are encapsulated into JDWP command packages and sent to the debugee through the transport layer. After the debugee receives the JDWP command package, it parses the command and converts it into a JVMTI call, which is run on the debugee.
A similar situation is that JVMTI converts the running results into the form of JDWP data packets, sends the results to the debugger and passes them back to the JDI call. The debugger developer obtains data and issues instructions through JDI.
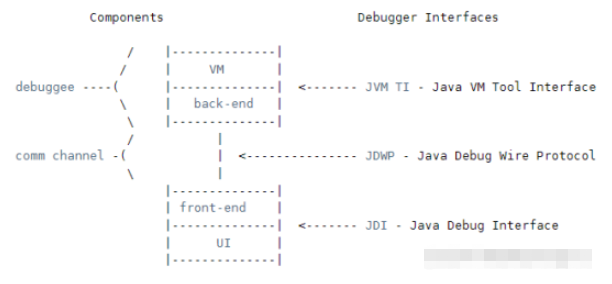
As shown in the figure above, JPDA consists of three layers:
JVM TI - Java VM tool interface . Defines the debugging services provided by the VM.
JDWP - Java debug communication protocol. Defines communication between the debugee and the debugger process.
#JDI - Java debugging interface. Defines a high-level Java language interface that tool developers can easily use to write remote debugger applications.
Through the JPDA interface, we can develop our own debugging tools. Through the interfaces and protocols provided by these JPDA, debugger developers can extend and customize Java debugging applications according to the needs of specific developers.
The IDE debugging tools we mentioned earlier are all developed based on the JPDA system. The only difference is that they may provide different graphical interfaces and have some different custom functions.
In addition, we should note that JPDA is a set of standards, and any JDK implementation must fulfill this standard. Therefore, the debugging tools developed through JPDA are inherently cross-platform and do not rely on virtual machine implementation. JDK version independent and other porting advantages, so most debugging tools are based on this system.
[1] Build a SpringBoot WEB project. The SpringBoot version we are currently using is 2.3.0.RELEASE. The corresponding tomcat version is 9.X.
Package the SpringBoot project and set the application port to 9999. Deploying this program to a Linux server, whether using a JAR package or Docker, has nothing to do with remote debugging.
[3] The code reference of the deployment program is as follows, which is a simple request processing printout information
/**
 *   测试程序
 * @author zhangyu
 * @date 2022/2/17
*/
@SpringBootApplication
@RestController
public class DebuggerApplication {

    public static void main(String[] args) {
        SpringApplication.run(DebuggerApplication.class, args);
    }

    @GetMapping("/test")
    public  String test(){
        System.out.println(111);
        System.out.println(222);
        return "OK";
    }

}[4] The deployment program startup parameters are as follows
java -Xdebug -Xrunjdwp:transport=dt_socket,server=y,suspend=n,address=8888 -jar debugger-0.0.1-SNAPSHOT.jar
where address= 8888 means opening port 8888 as the Socket communication port for remote debugging
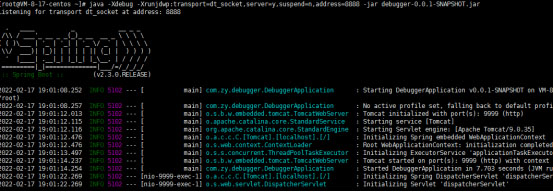
If it is an ordinary web project deployed under tomcat, refer to the following:
Less than tomcat9 version
tomcat 中 bin/catalina.sh 中增加 CATALINA_OPTS=‘-server -Xdebug -Xnoagent -Djava.compiler=NONE -Xrunjdwp:transport=dt_socket,server=y,suspend=n,address=18006’
如下图所示:

大于等于 tomcat9 版本
tomcat 中 bin/catalina.sh 中的 JPDA_ADDRESS=“localhost:8000” 这一句中的localhost修改为0.0.0.0(允许所有ip连接到8000端口,而不仅是本地)8000是端口,端口号可以任意修改成没有占用的即可
如下图所示:

【5】测试部署的程序正常后,下面构建客户端远程调试,当前以IDEA工具作为客户端
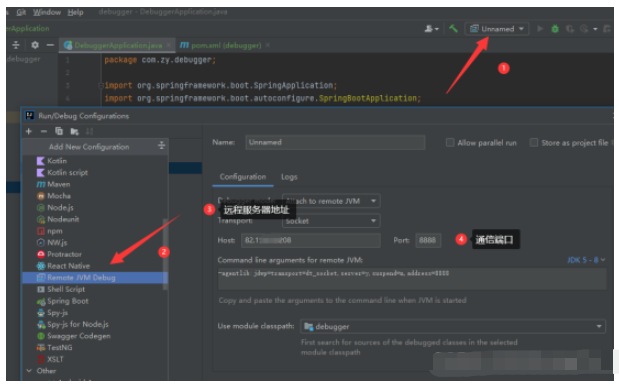
参考:
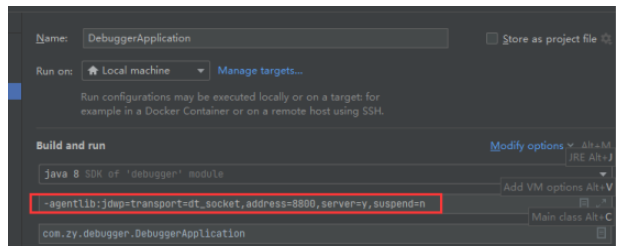
【1】-agentlib:jdwp=transport=dt_socket,server=y,suspend=n,address=8888
【2】Host:远程服务器地址
【3】Port:远程服务器开放的调试通信端口,非应用端口
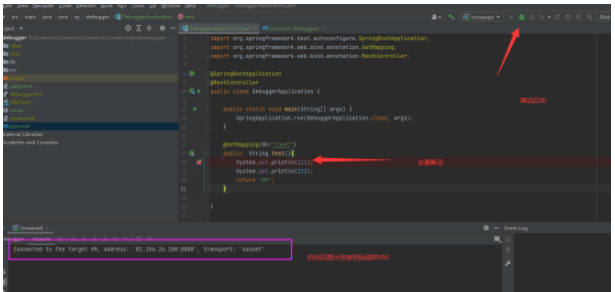

测试接口:http://XXX:9999/test。注意本地代码需要和远程部署程序一致。
通过上图可以看到客户端设置断点已经生效,其中在客户端执行了一个调试输出,这个是自定义输出的内容服务器程序并没有,在执行后右侧的服务器控制台日志输出了该信息,因此远程Debug是正常通信和处理的。
(一)调试参数详解
-Xdebug:启用调试特性
-Xrunjdwp:在目标 VM 中加载 JDWP 实现。它通过传输和 JDWP 协议与独立的调试器应用程序通信。下面介绍一些特定的子选项
从 Java V5 开始,您可以使用 -agentlib:jdwp 选项,而不是 -Xdebug 和 -Xrunjdwp。如果连接到VM版本低于V5的情况下,只能使用 -Xdebug 和 -Xrunjdwp 选项。下面简单描述 -Xrunjdwp 子选项。
-Djava.compiler=NONE: 禁止 JIT 编译器的加载
transport : 传输方式,有 socket 和 shared memory 两种,我们通常使用 socket(套接字)传输,但是在 Windows 平台上也可以使用shared memory(共享内存)传输。
server(y/n): VM 是否需要作为调试服务器执行
address: 调试服务器的端口号,客户端用来连接服务器的端口号
suspend(y/n):值是 y 或者 n,若为 y,启动时候自己程序的 VM 将会暂停(挂起),直到客户端进行连接,若为 n,自己程序的 VM 不会挂起

(1)被调试程序
创建一个SpringBoot的WEB项目,提供一个简单的测试接口,并在测试方法中提供一些方法参数变量和局部变量作为后面的调试测试用。
import org.springframework.boot.SpringApplication;
import org.springframework.boot.autoconfigure.SpringBootApplication;
import org.springframework.web.bind.annotation.GetMapping;
import org.springframework.web.bind.annotation.RestController;

@SpringBootApplication
@RestController
public class DebuggerApplication {

    public static void main(String[] args) {
        SpringApplication.run(DebuggerApplication.class, args);
    }

    @GetMapping("/test")
    public  String test(String name){
        System.out.println("进入方法");
        int var=100;
        System.out.println(name);
        System.out.println(var);
        System.out.println("方法结束");
        return "OK";
    }
}项目启动配置参考,需要启用Debug配置
(2)自定义调试器代码
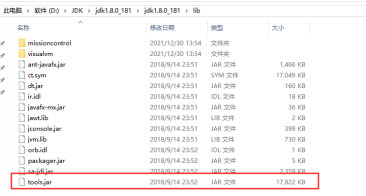
开发调试器需要JNI工具支持,JDI操作的API工具在tools.jar中 ,需要在 CLASSPATH 中添加/lib/tools.jar
import com.sun.jdi.*;
import com.sun.jdi.connect.AttachingConnector;
import com.sun.jdi.connect.Connector;
import com.sun.jdi.event.*;
import com.sun.jdi.request.BreakpointRequest;
import com.sun.jdi.request.EventRequest;
import com.sun.jdi.request.EventRequestManager;
import com.sun.tools.jdi.SocketAttachingConnector;

import java.util.List;
import java.util.Map;

/**
 *  通过JNI工具测试Debug
 * @author zhangyu
 * @date 2022/2/20
*/
public class TestDebugVirtualMachine {


    private static VirtualMachine vm;

    public static void main(String[] args) throws Exception {
        //获取SocketAttachingConnector,连接其它JVM称之为附加(attach)操作
        VirtualMachineManager vmm = Bootstrap.virtualMachineManager();
        List<AttachingConnector> connectors = vmm.attachingConnectors();
        SocketAttachingConnector sac = null;
        for(AttachingConnector ac : connectors) {
            if(ac instanceof SocketAttachingConnector) {
                sac = (SocketAttachingConnector) ac;
            }
        }
        assert sac != null;
        //设置好主机地址,端口信息
        Map<String, Connector.Argument> arguments = sac.defaultArguments();
        Connector.Argument hostArg = arguments.get("hostname");
        Connector.Argument portArg = arguments.get("port");
        hostArg.setValue("127.0.0.1");
        portArg.setValue(String.valueOf(8800));
        //进行连接
         vm = sac.attach(arguments);
        //相应的请求调用通过requestManager来完成
        EventRequestManager eventRequestManager = vm.eventRequestManager();
        //创建一个代码判断,因此需要获取相应的类,以及具体的断点位置,即相应的代码行。
        ClassType clazz = (ClassType) vm.classesByName("com.zy.debugger.DebuggerApplication").get(0);
        //设置断点代码位置
        Location location = clazz.locationsOfLine(22).get(0);
        //创建新断点并设置阻塞模式为线程阻塞,即只有当前线程被阻塞
        BreakpointRequest breakpointRequest = eventRequestManager.createBreakpointRequest(location);
        //设置阻塞并启动
        breakpointRequest.setSuspendPolicy(EventRequest.SUSPEND_EVENT_THREAD);
        breakpointRequest.enable();
        //获取vm的事件队列
        EventQueue eventQueue = vm.eventQueue();
        while(true) {
            //不断地读取事件并处理断点记录事件
            EventSet eventSet = eventQueue.remove();
            EventIterator eventIterator = eventSet.eventIterator();
            while(eventIterator.hasNext()) {
                Event event = eventIterator.next();
                execute(event);
            }
            //将相应线程resume,表示继续运行
            eventSet.resume();
        }
    }

    /**
     *  处理监听到事件
     * @author zhangyu
     * @date 2022/2/20
    */
    public static void execute(Event event) throws Exception {
        //获取的event为一个抽象的事件记录,可以通过类型判断转型为具体的事件,这里我们转型为BreakpointEvent,即断点记录,
        BreakpointEvent breakpointEvent = (BreakpointEvent) event;
        //并通过断点处的线程拿到线程帧,进而获取相应的变量信息,并打印记录。
        ThreadReference threadReference = breakpointEvent.thread();
        StackFrame stackFrame = threadReference.frame(0);
        List<LocalVariable> localVariables = stackFrame.visibleVariables();
        //输出当前线程栈帧保存的变量数据
        localVariables.forEach(t -> {
            Value value = stackFrame.getValue(t);
            System.out.println("local->" + value.type() + "," + value.getClass() + "," + value);
        });
    }

}(3)代码分析
【1】通过Bootstrap.virtualMachineManager();获取连接器,客户端即通过相应的connector进行连接,配置服务器程序ip地址和端口,连接后获取对应服务器的VM信息。
定位目标debug的类文件,可通过遍历获取的类集合并结合VirtualMachine获取类信息实现
【3】对目标类代码特定位置设置并启用断点
【4】记录断点信息,阻塞服务器线程,并根据对应事件获取相应的信息
【5】执行event.resume释放断点,服务器程序继续运行
(4)运行测试
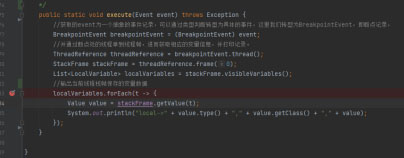
启动 SpringBoot 的 web 项目,也就是服务器程序。启动调试器代码时使用debug模式,并在该位置查看所获取的信息,同时避免直接释放断点。
【2】Set the breakpoint location to line 22 of the DebuggerApplication class
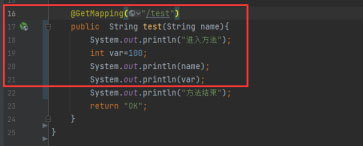
【3】Test the interface after startup. You can find that the server program console prints the following results. Line 22 has not been executed yet.
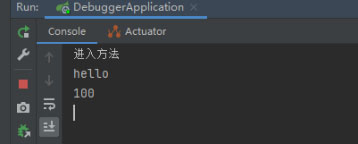
【4】At this time, the debugger program is being observed. You can see that the data of the server program stack frame has been obtained

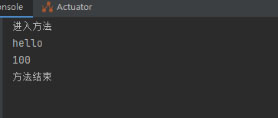
#[5] Release the breakpoint, and the server will run normally and complete the request processing process
The above is the detailed content of What is the principle of Java platform debugging system?. For more information, please follow other related articles on the PHP Chinese website!


