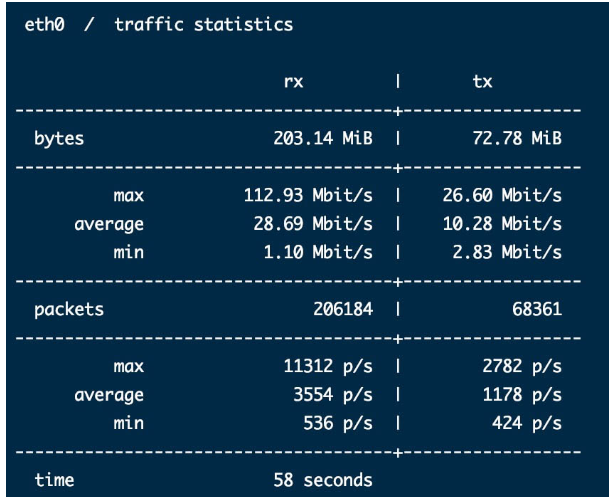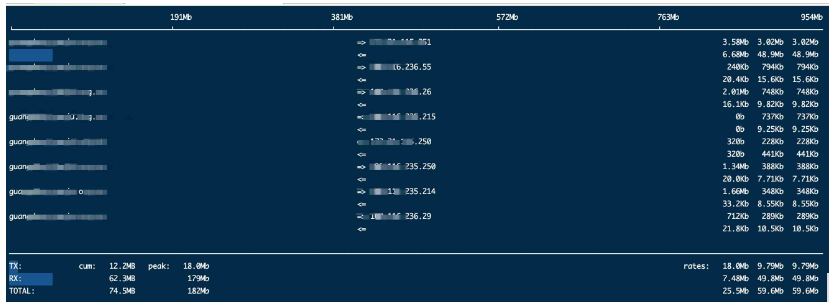
There are three commands vnstat, iftop and nethogs (recommended)
all require additional installation of software using yum or apt-get
vnstat -i eth0 -l #实时流量情况
There are other commands to use --help to view

After ctrl c ends, the traffic statistics results during the monitoring period will be displayed

iftop can be used to monitor the real-time traffic of the network card (you can specify the network segment), reversely analyze IP, and display port information Wait
Command usage:
-iSet the monitored network card, such as: # iftop -i eth2
-BDisplay traffic in bytes (default is bits), such as: # iftop -B
-nmakes the host information directly display the IP by default, such as: # iftop -n
-Nmakes the port information directly display the port number by default, For example: # iftop -N
Omit other... #Press n to switch to display the IP or host name of this machine;
Press s to switch whether to display the host information of this machine;
Press d Switch whether to display the host information of the remote target host;
Press t to switch the display format to 2 lines/1 line/only send traffic/only receive traffic;
Press N to switch to displaying the port number or port service name;
Press S to switch whether to display the port information of the machine;
Press D to switch whether to display the port information of the remote target host;
Press p to switch whether to display the port information;
Omit others …… Bandwidth utilization (recommended)
2. Monitor eth0 network bandwidth: nethogs eth0
Interactive command:
The following are some interactive commands (keyboard shortcuts) of NetHogs
m: Modify units
r
: Sort by traffics
: Sort by send trafficq: Exit the command prompt
Use screenshot:
The above is the detailed content of How to check the network speed and traffic usage occupied by a process in Linux. For more information, please follow other related articles on the PHP Chinese website!


