数据来源:population_data.json,
先看一下数据长啥样
[
  {
    "Country Name": "Arab World",
    "Country Code": "ARB",
    "Year": "1960",
    "Value": "96388069"
  },
  {
    "Country Name": "Arab World",
    "Country Code": "ARB",
    "Year": "1961",
    "Value": "98882541.4"
  },
省略。。。。
]'''这个文件实际上就是一个很长的Python列表,其中每个元素都是一个包含四个键的字典:
国家名、国别码、年份以及表示人口数量的值。
我们只关心每个国家2010年的人口数量,因此我们首先编写一个打印这些信息的程序:'''
import json
#将数据加载到一个列表中
filename= 'population_data.json'
with open(filename) as f :
    pop_data = json.load(f)
#打印每个国家2010年的人口数量
for pop_dic in pop_data :
     if pop_dic["Year"] == '2010' :
         country_name= pop_dic['Country Name']
         population =int(float(pop_dic['Value']) )#population_data.json中的每个键和值都是字符串。为处理这些人口数据,我们需要将表示人口数量的字符串转换为数字值,为此我们使用函数int():
         print(country_name + ":" + str(population))
rab World:357868000
Caribbean small states:6880000
East Asia & Pacific (all income levels):2201536674
East Asia & Pacific (developing only):1961558757
Euro area:331766000
Europe & Central Asia (all income levels):890424544
Europe & Central Asia (developing only):405204000'''制作地图前,还需要解决数据存在的最后一个问题。Pygal中的地图制作工具要求数据为特定的格式:用国别码表示国家,以及用数字表示人口数量。处理地理政治数据时,经常需要用到几个标准化国别码集。
population_data.json中包含的是三个字母的国别码,但Pygal使用两个字母的国别码。我们需要想办法根据国家名获取两个字母的国别码。
Pygal使用的国别码存储在模块i18n(internationalization的缩写)中。
字典COUNTRIES包含的键和值分别为两个字母的国别码和国家名。
要查看这些国别码,可从模块i18n中导入这个字典,并打印其键和值:'''
from pygal_maps_world.i18n import COUNTRIES
for country_code in sorted(COUNTRIES.keys()):
    print(country_code, COUNTRIES[country_code])
ad Andorra
ae United Arab Emirates
af Afghanistan
al Albania为获取国别码,我们将编写一个函数,它在COUNTRIES中查找并返回国别码。
我们将这个函数放在一个名为country_codes的模块中,以便能够在可视化程序中导入它:
from pygal_maps_world.i18n import COUNTRIES
def get_country_code(country_name):
    #根据指定的国家,返回Pygal使用的两个字母的国别码
    for code,name in COUNTRIES.items():
        if name == country_name :
            return code
    # 如果没有找到指定的国家,就返回None
    return None
#打印每个国家2010年的人口数量
for pop_dic in pop_data :
     if pop_dic["Year"] == '2010' :
         country_name= pop_dic['Country Name']
         population =int(float(pop_dic['Value']) )#population_data.json中的每个键和值都是字符串。为处理这些人口数据,我们需要将表示人口数量的字符串转换为数字值,为此我们使用函数int():
         code =  get_country_code(country_name)
         if code :
             print(code + ":" + str(population))
         else:
            print('error - ' + ":" + str(population))
error - :357868000
error - :6880000
error - :2201536674
error - :1961558757
error - :331766000导致显示错误消息的原因有两个。首先,并非所有人口数量对应的都是国家,有些人口数量对应的是地区(阿拉伯世界)和经济类群(所有收入水平)。
其次,有些统计数据使用了不同的完整国家名(如Yemen, Rep.,而不是Yemen)。当前,我们将忽略导致错误的数据,看看根据成功恢复了的数据制作出的地图是什么样的。
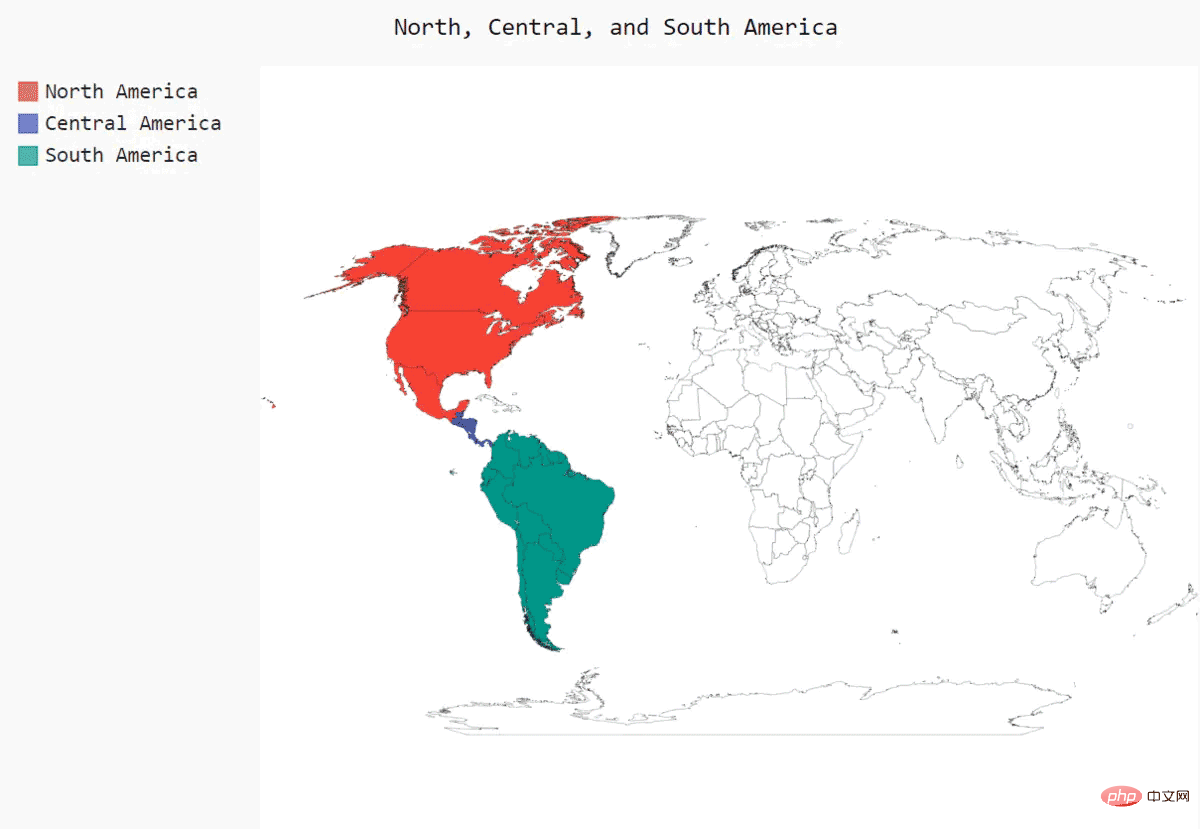
import pygal_maps_world.maps#创建了一个Worldmap实例,并设置了该地图的的title属性
wm = pygal_maps_world.maps.World()
wm.title = 'North, Central, and South America'
'''
了方法add(),它接受一个标签和一个列表,其中后者包含我们要突出的国家的国别码。每次调用add()都将为指定的国家
选择一种新颜色,并在图表左边显示该颜色和指定的标签。我们要以同一种颜色显示整个北美地区,因此第一次调用add()
时,在传递给它的列表中包含'ca'、'mx'和'us',以同时突出加拿大、墨西哥和美国。接下来,对中美和南美国家做同样
的处理。
'''
wm.add('North America', ['ca', 'mx', 'us'])
wm.add('Central America', ['bz', 'cr', 'gt', 'hn', 'ni', 'pa', 'sv'])
wm.add('South America', ['ar', 'bo', 'br', 'cl', 'co', 'ec', 'gf',
'gy', 'pe', 'py', 'sr', 'uy', 've'])
'''
方法render_to_file()创建一个包含该图表的.svg文件,你可以在浏览器中打开它。输出是一幅以不同颜色突出北美、
中美和南美的地图
'''
wm.render_to_file('americas.svg')

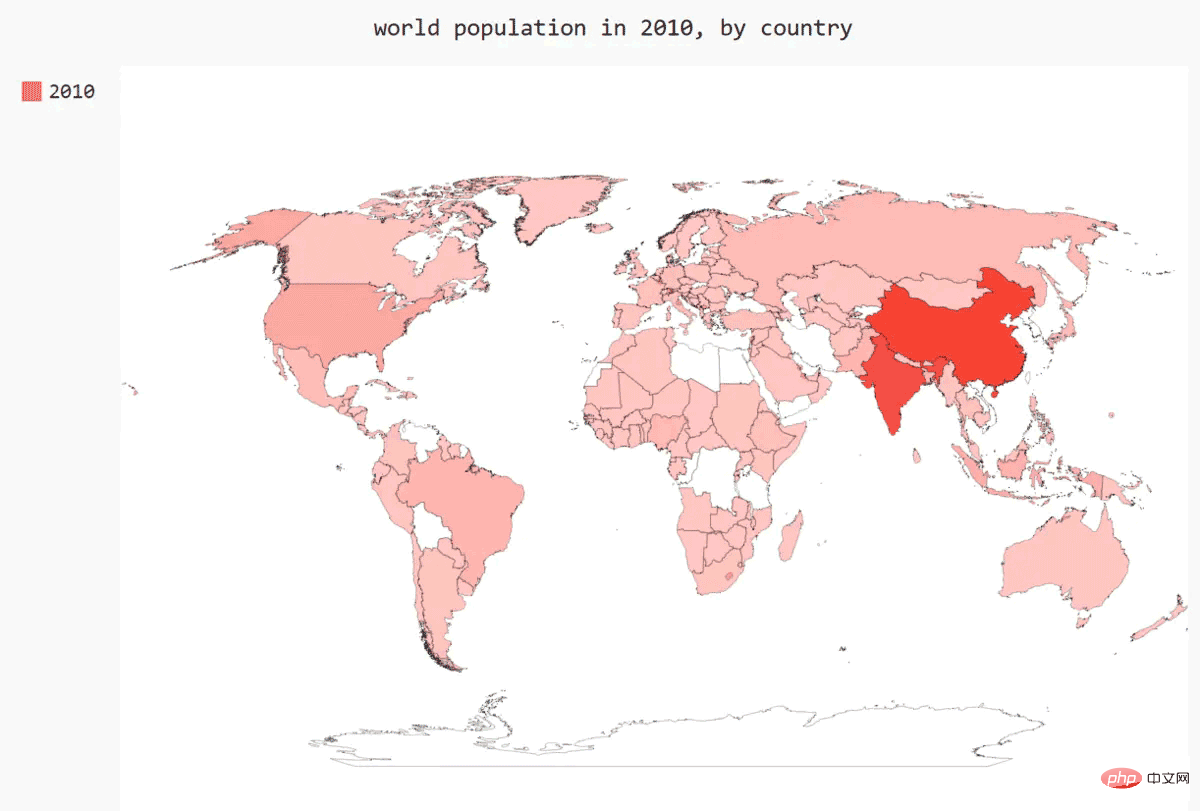
'''要呈现其他国家的人口数量,需要将前面处理的数据转换为Pygal要求的字典格式:键为两个字母的国别码,值为人口数量。
为此,在world_population.py中添加如下代码:
import json
#将数据加载到一个列表中
filename= 'population_data.json'
with open(filename) as f :
    pop_data = json.load(f)
def get_country_code(country_name):
    #根据指定的国家,返回Pygal使用的两个字母的国别码
    for code,name in COUNTRIES.items():
        if name == country_name :
            return code
    # 如果没有找到指定的国家,就返回None
    return None
#创建一个包含人口数量是字典
cc_populations = {}
#打印每个国家2010年的人口数量
for pop_dic in pop_data :
     if pop_dic["Year"] == '2010' :
         country_name= pop_dic['Country Name']
         population =int(float(pop_dic['Value']) )#population_data.json中的每个键和值都是字符串。为处理这些人口数据,我们需要将表示人口数量的字符串转换为数字值,为此我们使用函数int():
         code =  get_country_code(country_name)
         if code :
            cc_populations[code] =  population
import pygal_maps_world.maps#创建了一个Worldmap实例,并设置了该地图的的title属性
wm = pygal_maps_world.maps.World()
wm.title = 'world population in 2010, by country'
wm.add('2010', cc_populations)
wm.render_to_file('world_population.svg')
import json
#将数据加载到一个列表中
filename= 'population_data.json'
with open(filename) as f :
pop_data = json.load(f)
def get_country_code(country_name):
#根据指定的国家,返回Pygal使用的两个字母的国别码
for code,name in COUNTRIES.items():
if name == country_name :
return code
# 如果没有找到指定的国家,就返回None
return None
#创建一个包含人口数量是字典
cc_populations = {}
#打印每个国家2010年的人口数量
for pop_dic in pop_data :
if pop_dic["Year"] == '2010' :
country_name= pop_dic['Country Name']
population =int(float(pop_dic['Value']) )#population_data.json中的每个键和值都是字符串。为处理这些人口数据,我们需要将表示人口数量的字符串转换为数字值,为此我们使用函数int():
code = get_country_code(country_name)
if code :
cc_populations[code] = population
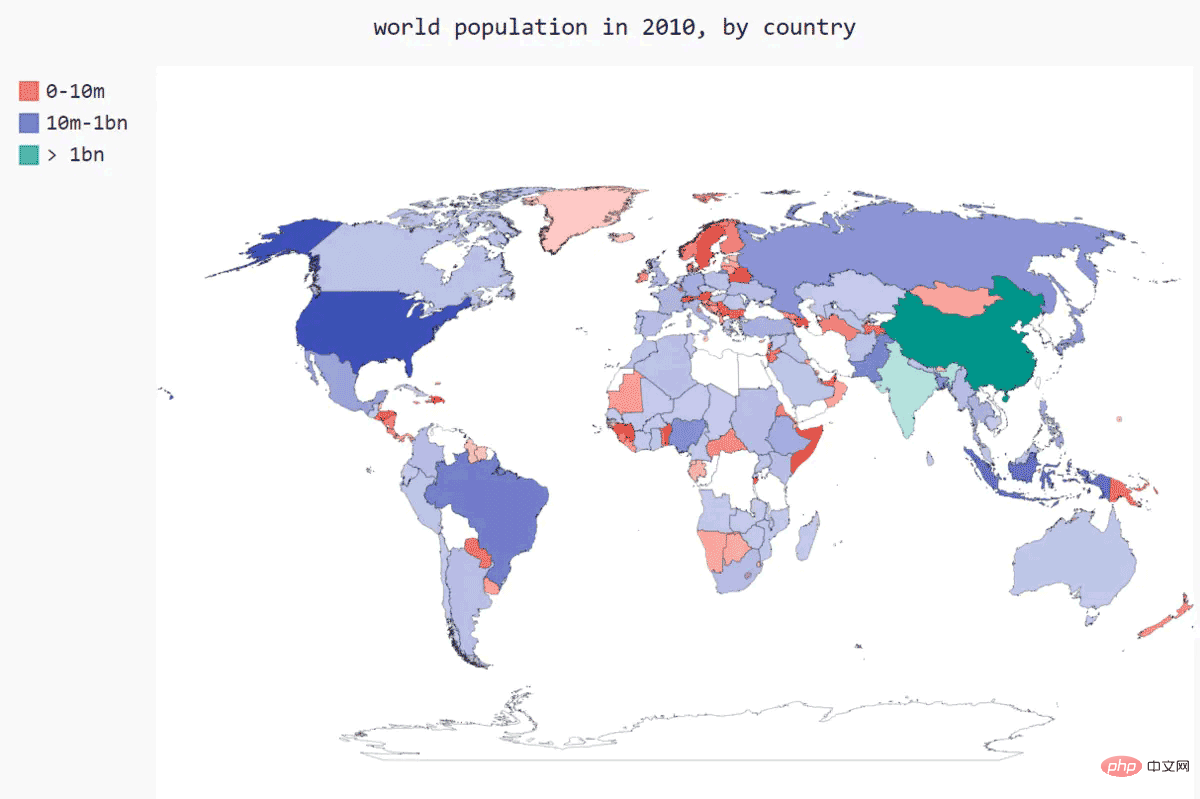
###根据人口数量将国家分3组
cc_pop_1,cc_pop_2,cc_pop_3 = {},{},{}
for cc,pop in cc_populations.items():
if pop < 10000000:
cc_pop_1[cc] = pop
elif pop < 1000000000:
cc_pop_2[cc] = pop
else:
cc_pop_3[cc] = pop
import pygal_maps_world.maps#创建了一个Worldmap实例,并设置了该地图的的title属性
wm = pygal_maps_world.maps.World()
wm.title = 'world population in 2010, by country'
wm.add('0-10m', cc_pop_1)
wm.add('10m-1bn', cc_pop_2)
wm.add('> 1bn', cc_pop_3)
wm.render_to_file('world_population.svg')
在这个地图中,根据人口将国家分组虽然很有效,但默认的颜色设置很难看。例如,在这里,Pygal选择了鲜艳的粉色和绿色基色。
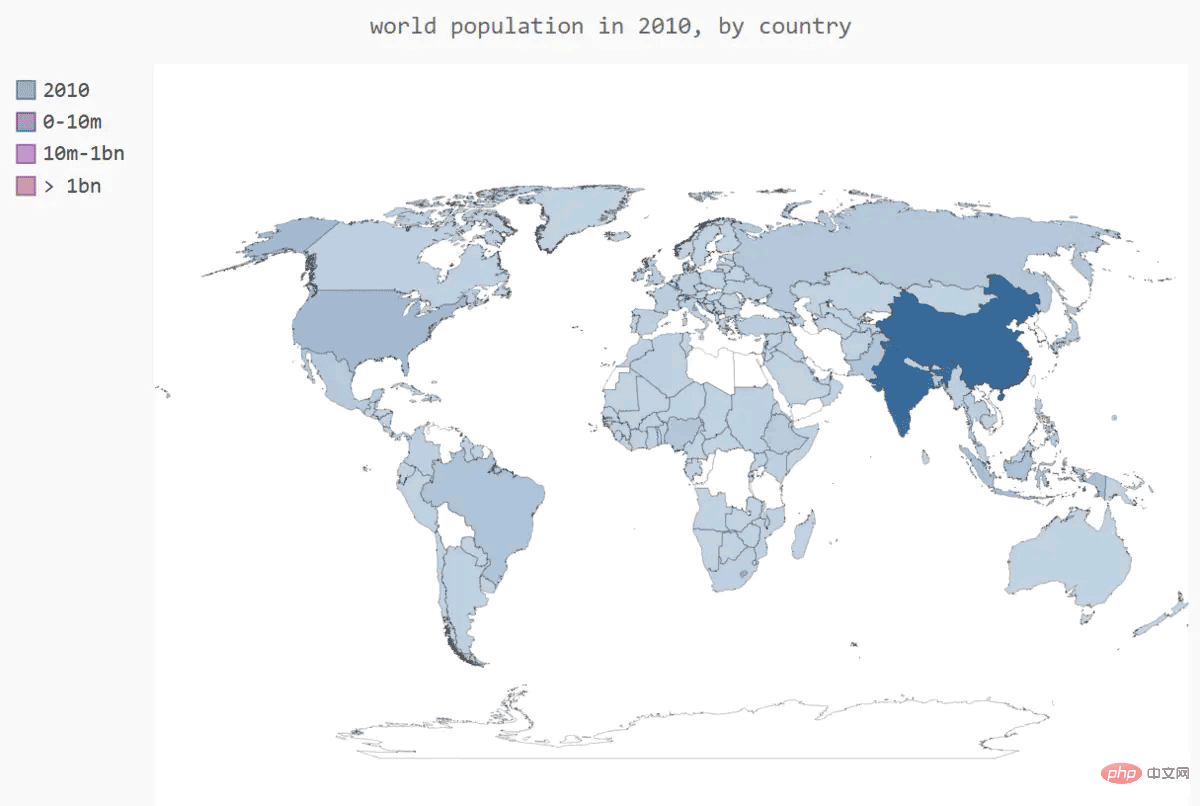
下面使用Pygal样式设置指令来调整颜色。我们也让Pygal使用一种基色,但将指定该基色,并让三个分组的颜色差别更大
###根据Pygal设置世界地图的样式
'''
在这个地图中,根据人口将国家分组虽然很有效,但默认的颜色设置很难看。例如,在这里,Pygal选择了鲜艳的粉色
和绿色基色。下面使用Pygal样式设置指令来调整颜色。我们也让Pygal使用一种基色,但将指定该基色,并让三个分组
的颜色差别更大
'''
###根据人口数量将国家分组
import json
#将数据加载到一个列表中
filename= 'population_data.json'
with open(filename) as f :
pop_data = json.load(f)
def get_country_code(country_name):
#根据指定的国家,返回Pygal使用的两个字母的国别码
for code,name in COUNTRIES.items():
if name == country_name :
return code
# 如果没有找到指定的国家,就返回None
return None
#创建一个包含人口数量是字典
cc_populations = {}
#打印每个国家2010年的人口数量
for pop_dic in pop_data :
if pop_dic["Year"] == '2010' :
country_name= pop_dic['Country Name']
population =int(float(pop_dic['Value']) )#population_data.json中的每个键和值都是字符串。为处理这些人口数据,我们需要将表示人口数量的字符串转换为数字值,为此我们使用函数int():
code = get_country_code(country_name)
if code :
cc_populations[code] = population
###根据人口数量将国家分3组
cc_pop_1,cc_pop_2,cc_pop_3 = {},{},{}
for cc,pop in cc_populations.items():
if pop < 10000000:
cc_pop_1[cc] = pop
elif pop < 1000000000:
cc_pop_2[cc] = pop
else:
cc_pop_3[cc] = pop
import pygal_maps_world.maps#创建了一个Worldmap实例,并设置了该地图的的title属性
from pygal.style import RotateStyle
from pygal.style import LightColorizedStyle#加亮颜色主题
wm_style = RotateStyle('#336699', base_style= LightColorizedStyle)
wm = pygal_maps_world.maps.World(style = wm_style)
wm.title = 'world population in 2010, by country'
wm.add('2010', cc_populations)
wm.add('0-10m', cc_pop_1)
wm.add('10m-1bn', cc_pop_2)
wm.add('> 1bn', cc_pop_3)
wm.render_to_file('world_population.svg')
The above is the detailed content of How to draw a world population map in python. For more information, please follow other related articles on the PHP Chinese website!


