


As machine learning models become more popular for predicting and analyzing data, the use of random forest algorithms is gaining momentum. Random Forest is a supervised learning algorithm used for regression and classification tasks in the field of machine learning. It works by building a large number of decision trees at training time and outputting classes, either the mode of the class (classification) or the average prediction of a single tree (regression).
#In this article, we will discuss how to implement the random forest algorithm using online real-world data sets. We will also provide detailed code explanations and descriptions of each step, as well as an evaluation of model performance and visualization.
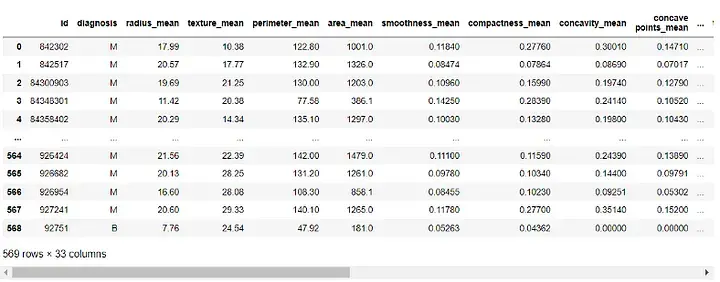
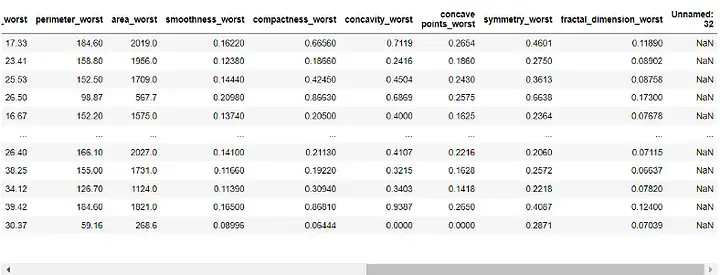
The dataset we will use is the "Breast Cancer Wisconsin (Diagnostic) Dataset", which is publicly available and can be accessed through the UCI Machine Learning Repository. The dataset has 569 instances with 30 attributes and two categories - malignant and benign. Our goal is to classify these instances based on 30 attributes and determine whether they are benign or malignant. You can download the dataset from https://www.kaggle.com/datasets/uciml/breast-cancer-wisconsin-data.
First, we will import the necessary libraries:
import pandas as pd
import numpy as np
import matplotlib.pyplot as plt
from sklearn.model_selection import train_test_split
from sklearn.ensemble import RandomForestClassifier
from sklearn.metrics import accuracy_score, confusion_matrix, classification_report
Next, we will load the dataset:
df = pd.read_csv(r"C:UsersUserDownloadsdatabreast_cancer_wisconsin_diagnostic_dataset.csv")
df
Output:
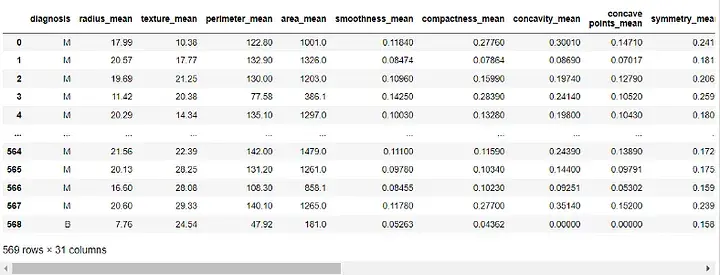
##Before building the model, we need to preprocess the data. Since the 'id' and 'Unnamed: 32' columns are of no use to our model, we will delete it:
df = df.drop([ 'id' , 'Unnamed: 32' ], axis=1)
df
Output:
Next, we will assign the "Diagnostic" column to our target variable and remove it from our features:
target = df['diagnosis']
features = df.drop('diagnosis', axis=1)We will now split our dataset into training and test sets. We will use 70% of the data for training and 30% for testing:
X_train, X_test, y_train, y_test = train_test_split(features, target, test_size=0.3, random_state=42)
With our data preprocessed and split into training and test sets, We can now build our random forest model:
rf = RandomForestClassifier(n_estimators=100, random_state=42)
rf.fit(X_train, y_train)
Here we set the number of decision trees in the forest to 100 and set the random state to Ensure reproducibility of results.
Now, we can evaluate the performance of the model. We will use the accuracy score, confusion matrix, and classification report for evaluation:
y_pred = rf.predict(X_test)
# 准确度分数
print("Accuracy Score:", accuracy_score(y_test, y_pred))
# Confusion Matrix
conf_matrix = confusion_matrix(y_test, y_pred)
print("Confusion Matrix:n", conf_matrix)
# Classification Report
class_report = classification_report(y_test, y_pred)
print("Classification Report:n", class_report)Output:
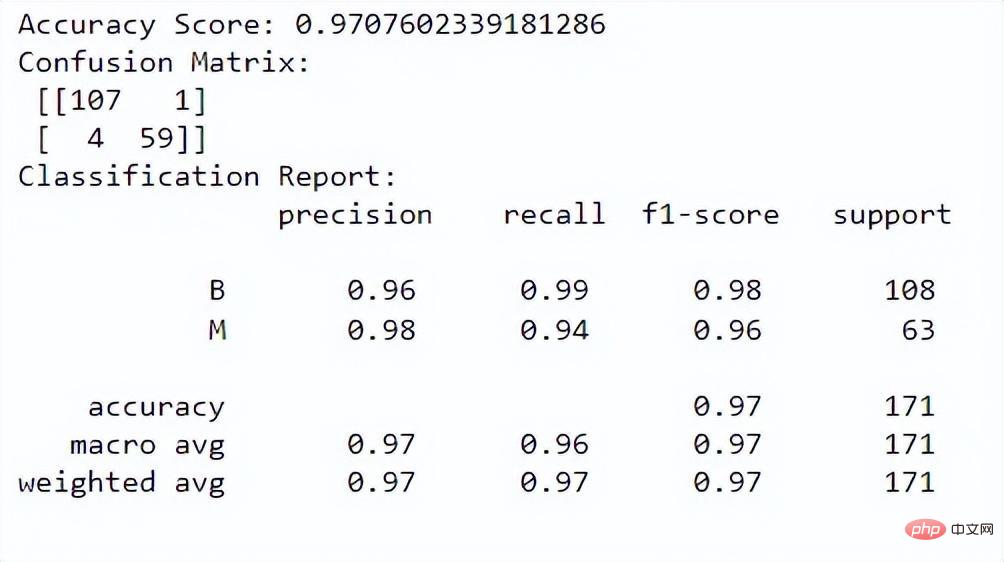
The accuracy score tells us how well the model performs at correctly classifying instances. The confusion matrix gives us a better understanding of the classification performance of our model. The classification report provides us with precision, recall, f1 score, and support values for both classes.
Finally, we can visualize the importance of each feature in the model. We can do this by creating a bar chart showing the feature importance values:
importance = rf.feature_importances_
feat_imp = pd.Series(importance, index=features.columns)
feat_imp = feat_imp.sort_values(ascending=False)
plt.figure(figsize=(12,8))
feat_imp.plot(kind='bar')
plt.ylabel('Feature Importance Score')
plt.title("Feature Importance")
plt.show()Output:
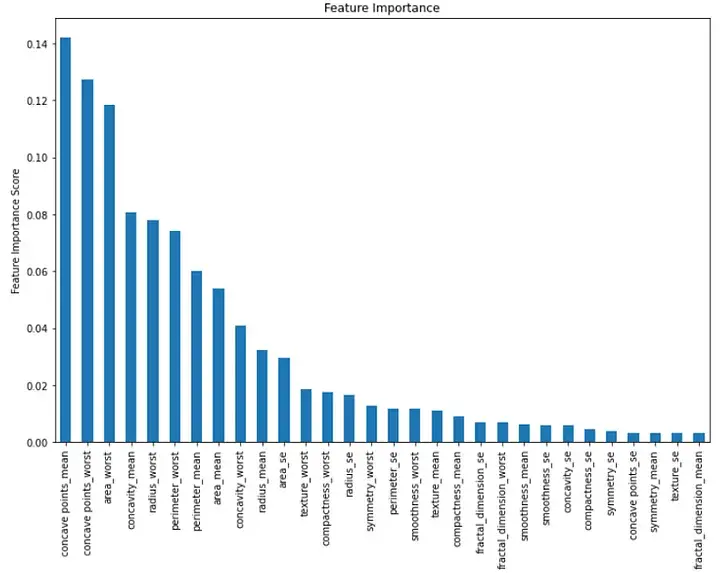
#This bar chart displays the importance of each feature in descending order. We can see that the first three important features are "mean concave", "worst concave" and "worst region".
In summary, implementing the random forest algorithm in machine learning is a powerful tool for classification tasks. We can use this to classify instances based on multiple features and evaluate the performance of our model. In this paper, we use an online real-world dataset and provide detailed code explanations and descriptions of each step, as well as an evaluation of model performance and visualization.
The above is the detailed content of A guide to implementing the random forest algorithm in machine learning. For more information, please follow other related articles on the PHP Chinese website!


![[Web front-end] Node.js quick start](https://img.php.cn/upload/course/000/000/067/662b5d34ba7c0227.png)


