Practical tips to get a feel for your Linux memory, disk, CPU, and network

WBOY
Release: 2022-01-21 16:42:19
forward
1636 people have browsed it

This article brings you knowledge about how to check the various statuses of Linux in Linux, including: network IO, disk, CPU, memory and other related knowledge. I hope it will be helpful to everyone.

Practical tips to get a feel for your Linux memory, disk, CPU, and network

Today’s focus:

① Learn to check the various statuses of Linux, including: network IO, disk, CPU, Memory, etc.;

② Learn to understand the meaning of commands and be able to quickly discover problems in the cluster.

1. Core commands

linux monitors network IO, disk, CPU, memory:

  • CPU: vmstat, sar –u, top
  • Disk IO: iostat –xd, sar –d, top
  • Network IO: iftop -n, ifstat, dstat –nt, sar -n DEV 2 3
  • Disk capacity: df –h
  • Memory usage: free – m, top

2, common commands

(1) Memory: number of bars, size of each bar, whether the memory is DDR4 or DDR3, memory frequency is 2666MT/S or 1600MT/s

number of entries: dmidecode|grep -A5 'Memory Device'|grep Size | grep -v Installed |wc -l

Size of each item: dmidecode|grep -A5 'Memory Device'|grep Size | grep -v Installed |uniq

Memory type: dmidecode | grep -A16 "Memory Device" | grep 'Type:' | grep -v Unknown |uniq

Memory frequency: dmidecode | grep -A16 "Memory Device" | grep 'Speed' | grep -v Unknown |uniq

(2) Hard disk: number of blocks, size

fdisk -l | grep "Disk /dev/sd"

(3) Check what process occupies the port

netstat -antp | fgrep

(4) Check the process resources

  1. jps -l       # Get the process id
  2. jmap -heap 21046

(5) Number of CPUs

cat /proc/cpuinfo| grep "physical id"| sort| uniq| wc -l

(6)CPU core number

cat /proc/cpuinfo| grep "cpu cores"| uniq

(7)CPU frequency

cat /proc/cpuinfo| grep "model name"| uniq


3. Detailed explanation of core commands

3.1. ps aux

ps command is used to view the process status in the system

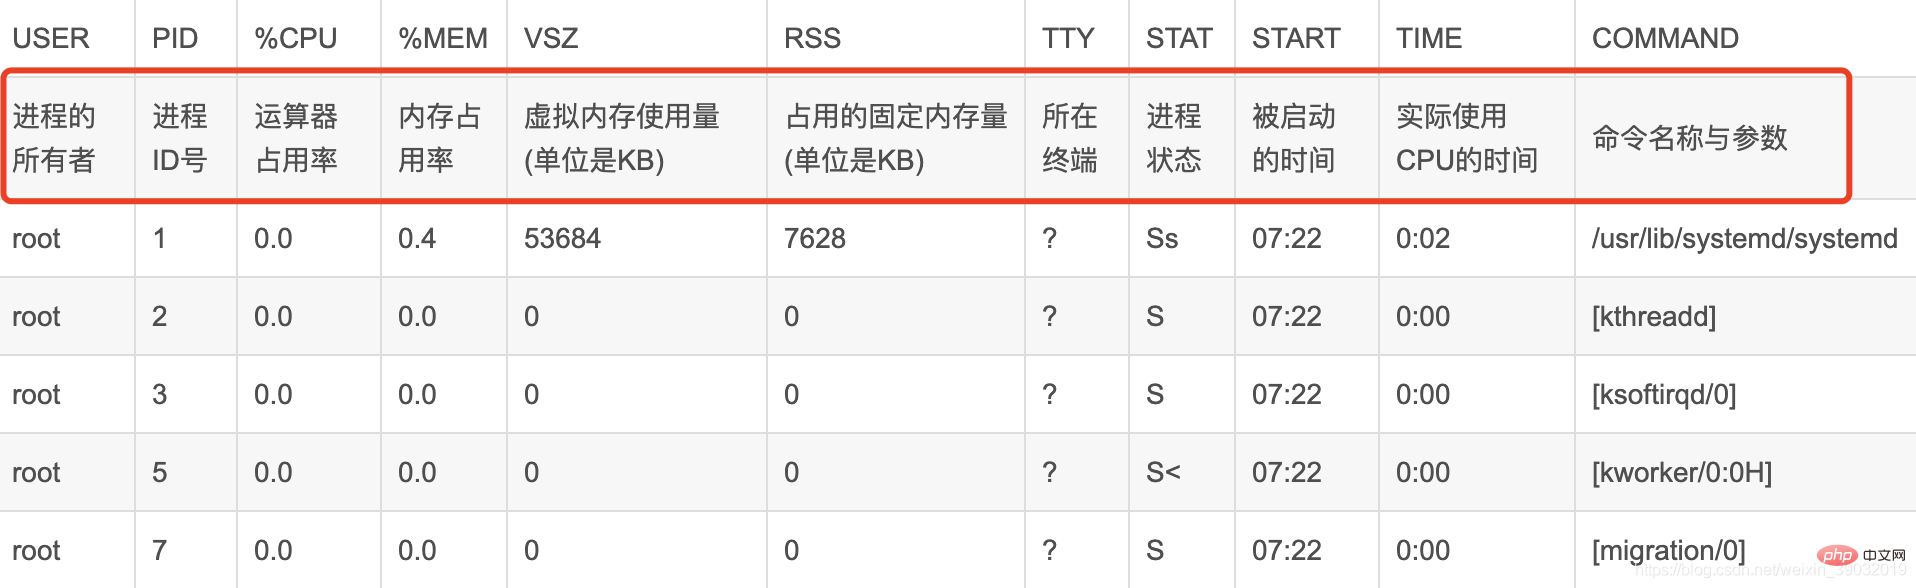
USER PID %CPU %MEM VSZ RSS TTY STAT START TIME COMMAND
● USER, the user name of the process owner.
● PID, process number, can uniquely identify the process.
● %CPU, the CPU time occupied by the process since the last refresh and the percentage of the total time.
● %MEM, the percentage of memory used by the process.
● VSZ, the virtual memory size used by the process, in K.
● RSS, the total amount of physical memory occupied by the process, in K.
● TTY, process-related terminal name.
● STAT, process status, used (R--running or ready to run; S--sleep state; I--idle; Z--frozen; D--uninterrupted sleep; W-process has no resident pages; T stop or track.) these letters to represent.
● START, the time when the process starts running.
● TIME, the total CPU time used by the process.
● COMMAND, the command line to be executed.


3.2. Top

The top command is a commonly used performance analysis tool under Linux, which can display the resource usage of each process in the system in real time, similar to Windows task manager.

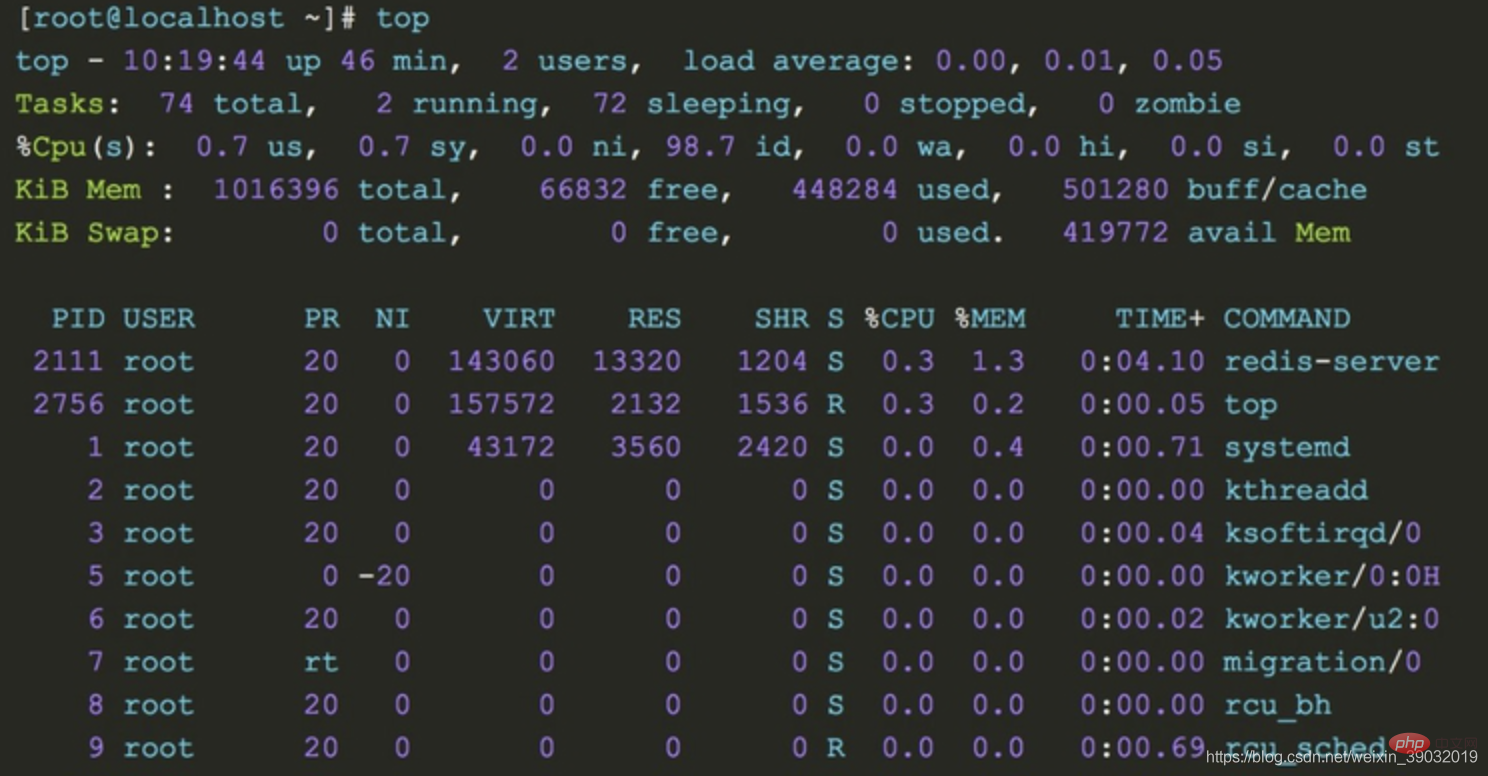
1. The upper part shows the overall system load:

  • top row: From left to right are the current system time, system running time, and the average load value of the system’s CPU in the previous 1min, 5min, and 15min
  • Tasks line: This line gives the overall statistical information of the process, including the total number of processes within the statistical period, the number of running processes, the number of dormant state processes, the number of stopped state processes and the number of zombie state processes
  • Cpu(s) line: Overall cpu statistical information, including the ratio of cpu time occupied by processes in user mode and system mode. Processes with a nice value greater than 0 occupy the cpu time ratio in user mode. The cpu is in The time ratio of idle state, wait state, and the time ratio of processing hard interrupt and soft interrupt
  • Mem line: This line provides memory statistics, including total physical memory, used Memory, free memory and the amount of memory used as buffer
  • Swap line: Virtual memory statistics, including total amount of swap space, used swap area size, free swap area size and used The size of the swap space for caching

2. The lower part shows the running status of each process:

  • PID : Process pid
  • USER: The user who started the process
  • PR: The column value plus 100 is the process priority, if the priority is less than 100, then the process is a real-time process, otherwise it is a normal process. The real-time process has a higher priority and is easier to obtain CPU scheduling. In the above output, the java process priority is 120, which is a normal process. Process, the priority of the had process is 2, which is a real-time process. The priority RT of the migration process corresponds to 0, which is the highest priority.
  • NI: The nice priority value of the process, this column , the nice value of the real-time process is 0, and the nice value of the ordinary process ranges from -20~19
  • VIRT: The size of the virtual memory occupied by the process (default unit kB)
  • RES: The size of the physical memory occupied by the process (default unit kB)
  • SHR: The size of the shared memory occupied by the process (default unit kB)
  • S: The running status of the process
  • %CPU: The percentage of CPU occupied by the process during the sampling period
  • %MEM: Percentage of memory occupied by the process during the sampling period
  • TIME : Total cpu time used by the process
  • COMMAND: Command to pull up the process

1. Don’t panic if you encounter problems. Based on experience, you can then use commands to troubleshoot memory, disk, network, and CPU. The problems are just in these categories. You must not make changes in a hurry to complicate simple problems.

2. According to the above command, set the monitoring warning in advance. Monitoring and early warning can allow you to discover system performance information in time, such as the disk is almost full or the memory is overloaded. We can make adjustments in advance.

Related recommendations: "Linux Video Tutorial"

The above is the detailed content of Practical tips to get a feel for your Linux memory, disk, CPU, and network. For more information, please follow other related articles on the PHP Chinese website!

Related labels:
source:csdn.net
Statement of this Website
The content of this article is voluntarily contributed by netizens, and the copyright belongs to the original author. This site does not assume corresponding legal responsibility. If you find any content suspected of plagiarism or infringement, please contact [email protected]
Popular Tutorials
More>
Latest Downloads
More>
Web Effects
Website Source Code
Website Materials
Front End Template
About us Disclaimer Sitemap
php.cn:Public welfare online PHP training,Help PHP learners grow quickly!