Explore heap memory allocation in Node and talk about memory limits!
This article will take you to explore the heap memory allocation in Node and gain an in-depth understanding of the memory limitations in Node.js. I hope it will be helpful to you!

In this article, I will explore the heap memory allocation in Node, and then try to increase the memory to the limit that the hardware can bear. Then we'll find some practical ways to monitor Node's processes to debug memory-related issues.
OK, let’s set off once the preparations are complete!
You can pull the relevant code in the warehouse and clone the code from my GitHub:
https://github.com/beautifulcoder/node-memory-limitations
Introduction to V8 Garbage Collection
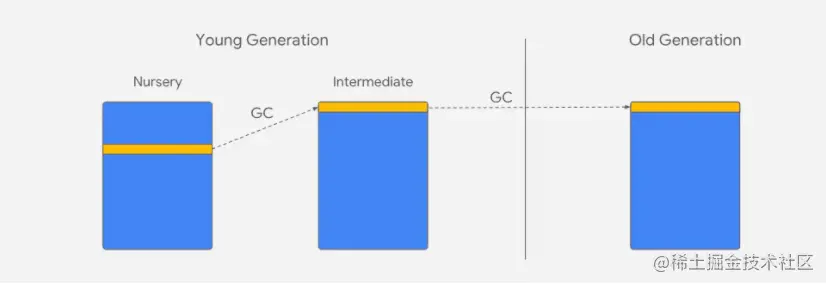
First, let’s briefly introduce the V8 garbage collector. The storage allocation method of memory is heap, which is divided into several generational areas. An object changes in age during its life cycle, and the generation to which it belongs also changes.
The generations are divided into the young generation and the old generation, and the young generation is also divided into the new generation and the middle generation. As objects survive garbage collection, they also join the old generation.

The basic principle of the generational hypothesis is that most subjects are young. The V8 garbage collector builds on this by only promoting objects that survive a garbage collection. As objects are copied to adjacent regions, they eventually end up in the old generation.
In Nodejs, memory consumption is mainly divided into three aspects:
- Code-the location where the code is executed
- Call stack- Used to store functions and local variables with primitive types (numbers, strings or Boolean values)
- Heap memory
Heap memory is our main focus today. Now that you know a little more about the garbage collector, it's time to allocate some memory on the heap!
function allocateMemory(size) {
  // Simulate allocation of bytes
  const numbers = size / 8;
  const arr = [];
  arr.length = numbers;
  for (let i = 0; i < numbers; i++) {
    arr[i] = i;
  }
  return arr;
}In the call stack, local variables are destroyed as the function call ends. The underlying type number never goes into heap memory, but is allocated in the call stack. But object arr will go into the heap and may survive garbage collection.
Is there a limit to heap memory?
Now for a brave test - push the Node process to the limit and see where it will run out of heap memory:
const memoryLeakAllocations = [];

const field = "heapUsed";
const allocationStep = 10000 * 1024; // 10MB

const TIME_INTERVAL_IN_MSEC = 40;

setInterval(() => {
  const allocation = allocateMemory(allocationStep);

  memoryLeakAllocations.push(allocation);

  const mu = process.memoryUsage();
  // # bytes / KB / MB / GB
  const gbNow = mu[field] / 1024 / 1024 / 1024;
  const gbRounded = Math.round(gbNow * 100) / 100;

  console.log(`Heap allocated ${gbRounded} GB`);
}, TIME_INTERVAL_IN_MSEC); In the above code, we are running at 40 milliseconds Approximately 10 mb are allocated at intervals, providing enough time for garbage collection to promote surviving objects to the old generation. process.memoryUsage is a tool for recycling rough metrics about heap utilization. As the heap allocation grows, the heapUsed field records the size of the heap. This field records the number of bytes in RAM and can be converted to MB.
Your results may vary. On a Windows 10 laptop with 32GB RAM you will get the following results:
Heap allocated 4 GB
Heap allocated 4.01 GB

<--- Last few GCs --->

[18820:000001A45B4680A0] 26146 ms: Mark-sweep (reduce) 4103.7 (4107.3) -> 4103.7 (4108.3) MB, 1196.5 / 0.0 ms (average mu = 0.112, current mu = 0.000) last resort GC in old space requested

<--- JS stacktrace --->

FATAL ERROR: CALL_AND_RETRY_LAST Allocation failed - JavaScript heap out of memory
Here, the garbage collector will try to compact the memory as a last resort, and finally give up and throw an "Out of Heap Memory" exception. This process reached the 4.1GB limit, and it took 26.6 seconds to realize that the service was about to be hung up.
Some of the reasons leading to the above results are still unknown. The V8 garbage collector originally ran in a 32-bit browser process with strict memory constraints. These results suggest that memory limitations may have been inherited from legacy code.
At the time of writing, the above code is running under the latest LTS Node version and uses a 64-bit executable. In theory, a 64-bit process should be able to allocate more than 4GB of space and easily grow to 16 TB of address space.
Expand memory allocation limit
node index.js --max-old-space-size=8000
This sets the maximum limit to 8GB. Be careful when doing this. My laptop has 32GB of space. I recommend setting it to the amount of space actually available in RAM. Once physical memory is exhausted, processes start taking up disk space through virtual memory. If you set the limit too high, you will get a new reason to change the computer. Here we try to avoid the computer from smoking~
Let’s run the code again with the 8GB limit:
Heap allocated 7.8 GB
Heap allocated 7.81 GB

<--- Last few GCs --->

[16976:000001ACB8FEB330] 45701 ms: Mark-sweep (reduce) 8000.2 (8005.3) -> 8000.2 (8006.3) MB, 1468.4 / 0.0 ms (average mu = 0.211, current mu = 0.000) last resort GC in old space requested

<--- JS stacktrace --->

FATAL ERROR: CALL_AND_RETRY_LAST Allocation failed - JavaScript heap out of memory
This time the heap size is almost 8GB, but not quite there. I suspect there is some overhead in the Node process for allocating so much memory. This time the process took 45.7 seconds to complete.
In a production environment, it may not take less than a minute to run out of memory. This is one reason why monitoring and gaining insight into memory consumption is helpful. Memory consumption will increase slowly over time, and it may take several days before you know there is a problem. If your process keeps crashing and "out of heap" exceptions appear in the logs, there may be a memory leak in your code.
The process may also take up more memory because it is processing more data. If resource consumption continues to grow, it may be time to break this monolith into microservices. This will reduce memory pressure on individual processes and allow nodes to scale horizontally.
如何跟踪 Node.js 内存泄漏
process.memoryUsage 的 heapUsed 字段还是有点用的,调试内存泄漏的一个方法是将内存指标放在另一个工具中以进行进一步处理。由于此实现并不复杂,因此主要解析下如何亲自实现。
const path = require("path");
const fs = require("fs");
const os = require("os");

const start = Date.now();
const LOG_FILE = path.join(__dirname, "memory-usage.csv");

fs.writeFile(LOG_FILE, "Time Alive (secs),Memory GB" + os.EOL, () => {}); // 请求-确认为了避免将堆分配指标放在内存中,我们选择将结果写入 CSV 文件以方便数据消耗。这里使用了 writeFile 带有回调的异步函数。回调为空以写入文件并继续,无需任何进一步处理。 要获取渐进式内存指标,请将其添加到 console.log:
const elapsedTimeInSecs = (Date.now() - start) / 1000;
const timeRounded = Math.round(elapsedTimeInSecs * 100) / 100;

s.appendFile(LOG_FILE, timeRounded + "," + gbRounded + os.EOL, () => {}); // 请求-确认上面这段代码可以用来调试内存泄漏的情况下,堆内存随着时间变化而增长。你可以使用一些分析工具来解析原生csv数据以实现一个比较漂亮的可视化。
如果你只是赶着看看数据的情况,直接用excel也可以,如下图:

在限制为4.1GB的情况下,你可以看到内存的使用率在短时间内呈线性增长。内存的消耗在持续的增长并没有变得平缓,这个说明了某个地方存在内存泄漏。在我们调试这类问题的时候,我们要寻找在分配在老世代结束时的那部分代码。
对象如果再在垃圾回收时幸存下来,就可能会一直存在,直到进程终止。
使用这段内存泄漏检测代码更具复用性的一种方法是将其包装在自己的时间间隔内(因为它不必存在于主循环中)。
setInterval(() => {
  const mu = process.memoryUsage();
  // # bytes / KB / MB / GB
  const gbNow = mu[field] / 1024 / 1024 / 1024;
  const gbRounded = Math.round(gbNow * 100) / 100;

  const elapsedTimeInSecs = (Date.now() - start) / 1000;
  const timeRounded = Math.round(elapsedTimeInSecs * 100) / 100;

  fs.appendFile(LOG_FILE, timeRounded + "," + gbRounded + os.EOL, () => {}); // fire-and-forget
}, TIME_INTERVAL_IN_MSEC);要注意上面这些方法并不能直接在生产环境中使用,仅仅只是告诉你如何在本地环境调试内存泄漏。在实际实现时还包括了自动显示、警报和轮换日志,这样服务器才不会耗尽磁盘空间。
跟踪生产环境中的 Node.js 内存泄漏
尽管上面的代码在生产环境中不可行,但我们已经看到了如何去调试内存泄漏。因此,作为替代方案,可以将 Node 进程包裹在 PM2 之类 的 守护进程 中。
当内存消耗达到限制时设置重启策略:
pm2 start index.js --max-memory-restart 8G
单位可以是 K(千字节)、M(兆字节)和 G(千兆字节)。进程重启大约需要 30 秒,因此通过负载均衡器配置多个节点以避免中断。
另一个漂亮的工具是跨平台的原生模块node-memwatch,它在检测到运行代码中的内存泄漏时触发一个事件。
const memwatch = require("memwatch");

memwatch.on("leak", function (info) {  // event emitted  console.log(info.reason);
});复制代码事件通过leak触发,并且它的回调对象中有一个reason会随着连续垃圾回收的堆增长而增长。
使用 AppSignal 的 Magic Dashboard 诊断内存限制
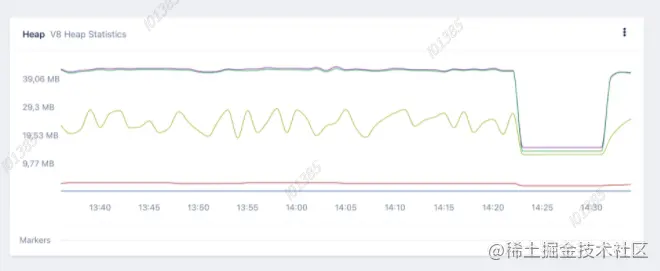
AppSignal 有一个神奇的仪表板,用于监控堆增长的垃圾收集统计信息。

上图显示请求在 14:25 左右停止了 7 分钟,允许垃圾回收以减少内存压力。当对象在旧的空间中停留太久并导致内存泄漏时,仪表板也会暴露出来。
总结:解决 Node.js 内存限制和泄漏
在这篇文章中,我们首先了解了 V8 垃圾回收器的作用,然后再探讨堆内存是否存在限制以及如何扩展内存分配限制。
最后,我们使用了一些潜在的工具来密切关注 Node.js 中的内存泄漏。我们看到内存分配的监控可以通过使用一些粗略的工具方法来实现,比如memoryUsage一些调试方法。在这里,分析仍然是手动实现的。
另一种选择是使用 AppSignal 等专业工具,它提供监控、警报和漂亮的可视化来实时诊断内存问题。
希望你喜欢这篇关于内存限制和诊断内存泄漏的快速介绍。
更多node相关知识,请访问:nodejs 教程!!
The above is the detailed content of Explore heap memory allocation in Node and talk about memory limits!. For more information, please follow other related articles on the PHP Chinese website!

Hot AI Tools

Undresser.AI Undress
AI-powered app for creating realistic nude photos

AI Clothes Remover
Online AI tool for removing clothes from photos.

Undress AI Tool
Undress images for free

Clothoff.io
AI clothes remover

Video Face Swap
Swap faces in any video effortlessly with our completely free AI face swap tool!

Hot Article

Hot Tools

Notepad++7.3.1
Easy-to-use and free code editor

SublimeText3 Chinese version
Chinese version, very easy to use

Zend Studio 13.0.1
Powerful PHP integrated development environment

Dreamweaver CS6
Visual web development tools

SublimeText3 Mac version
God-level code editing software (SublimeText3)

Hot Topics
 1386
1386
 52
52
 How to delete node in nvm
Dec 29, 2022 am 10:07 AM
How to delete node with nvm: 1. Download "nvm-setup.zip" and install it on the C drive; 2. Configure environment variables and check the version number through the "nvm -v" command; 3. Use the "nvm install" command Install node; 4. Delete the installed node through the "nvm uninstall" command.
 How to use express to handle file upload in node project
Mar 28, 2023 pm 07:28 PM
How to handle file upload? The following article will introduce to you how to use express to handle file uploads in the node project. I hope it will be helpful to you!
 An in-depth analysis of Node's process management tool 'pm2”
Apr 03, 2023 pm 06:02 PM
This article will share with you Node's process management tool "pm2", and talk about why pm2 is needed, how to install and use pm2, I hope it will be helpful to everyone!
 Pi Node Teaching: What is a Pi Node? How to install and set up Pi Node?
Mar 05, 2025 pm 05:57 PM
Detailed explanation and installation guide for PiNetwork nodes This article will introduce the PiNetwork ecosystem in detail - Pi nodes, a key role in the PiNetwork ecosystem, and provide complete steps for installation and configuration. After the launch of the PiNetwork blockchain test network, Pi nodes have become an important part of many pioneers actively participating in the testing, preparing for the upcoming main network release. If you don’t know PiNetwork yet, please refer to what is Picoin? What is the price for listing? Pi usage, mining and security analysis. What is PiNetwork? The PiNetwork project started in 2019 and owns its exclusive cryptocurrency Pi Coin. The project aims to create a one that everyone can participate
 Let's talk about how to use pkg to package Node.js projects into executable files.
Dec 02, 2022 pm 09:06 PM
How to package nodejs executable file with pkg? The following article will introduce to you how to use pkg to package a Node project into an executable file. I hope it will be helpful to you!
 What to do if npm node gyp fails
Dec 29, 2022 pm 02:42 PM
npm node gyp fails because "node-gyp.js" does not match the version of "Node.js". The solution is: 1. Clear the node cache through "npm cache clean -f"; 2. Through "npm install -g n" Install the n module; 3. Install the "node v12.21.0" version through the "n v12.21.0" command.
 Token-based authentication with Angular and Node
Sep 01, 2023 pm 02:01 PM
Authentication is one of the most important parts of any web application. This tutorial discusses token-based authentication systems and how they differ from traditional login systems. By the end of this tutorial, you will see a fully working demo written in Angular and Node.js. Traditional Authentication Systems Before moving on to token-based authentication systems, let’s take a look at traditional authentication systems. The user provides their username and password in the login form and clicks Login. After making the request, authenticate the user on the backend by querying the database. If the request is valid, a session is created using the user information obtained from the database, and the session information is returned in the response header so that the session ID is stored in the browser. Provides access to applications subject to
 A brief analysis of how node implements ocr
Oct 31, 2022 pm 07:09 PM
How to implement OCR (optical character recognition)? The following article will introduce to you how to use node to implement OCR. I hope it will be helpful to you!


