Chart types include: 1. Column charts that show data changes over a period of time; 2. Line charts that show continuous changes in data over time; 3. Pies that show the proportion of the size of each item in the data series to the sum of each item. Figure; 4. Bar chart showing comparison of data between various items; 5. Area chart emphasizing changes in volume over time; 6. Stock market chart showing stock fluctuation trends.

The operating environment of this tutorial: Windows 7 system, Microsoft Office Excel 2010 version, Dell G3 computer.
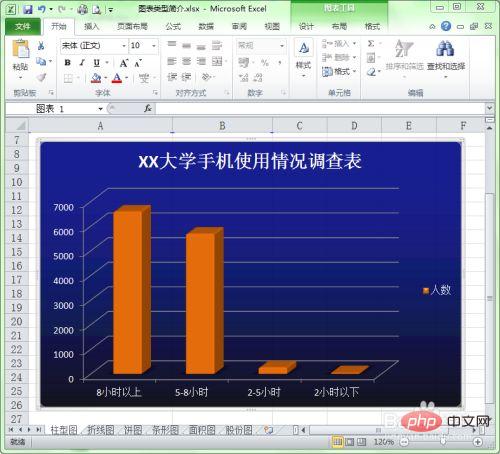
1. Column chart: Column chart is often used to display data changes over a period of time or to compare various data. In a column chart, categories are usually organized along the horizontal axis and values along the vertical axis. Data in columns or rows in an Excel table can be plotted into a column chart.
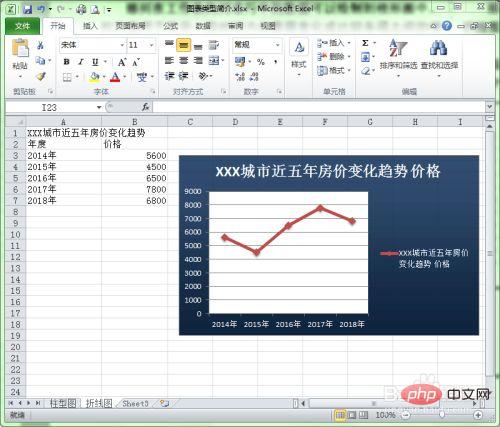
2. Line chart: Line chart is often used to display continuous data that changes over time, so it is very suitable for displaying the trend of data at equal time intervals.
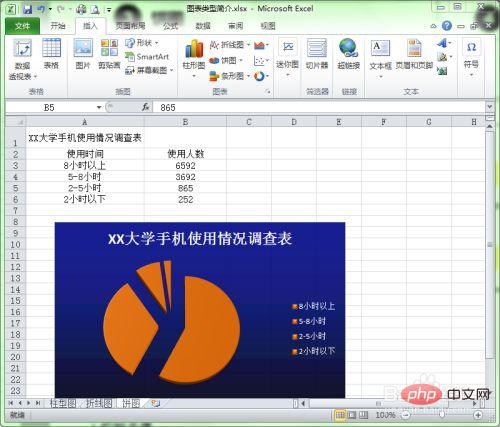
3. Pie chart: Pie chart is often used to show the ratio of the size of each item to the sum of each item in a data series, and can also show the percentage of the entire pie chart.
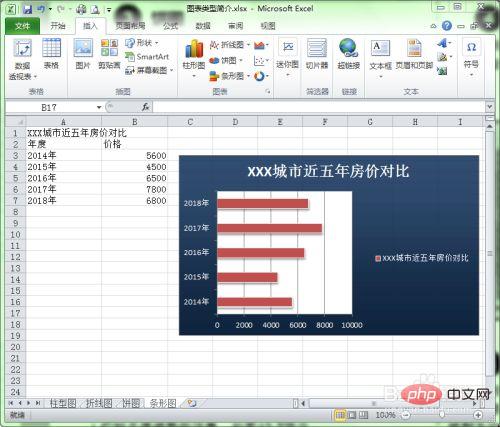
#4. Bar chart: Bar chart is often used to display data comparisons between various projects.
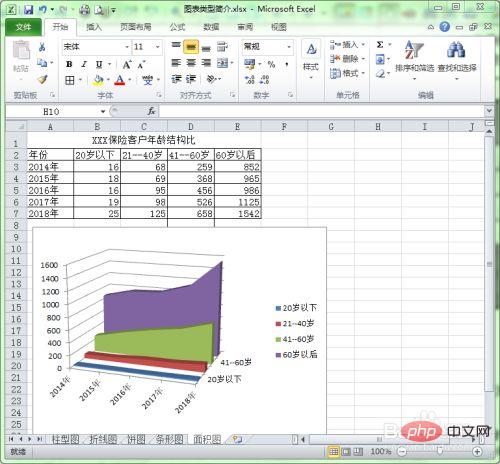
#5. Area chart: Area chart is used to emphasize the change of quantity over time. It can also be used to draw attention to trends in total value.
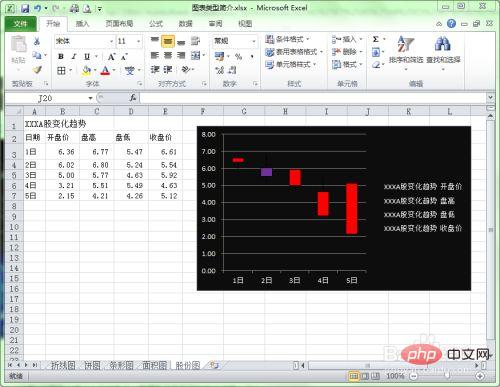
#6. Stock price chart: Stock chart is often used to show the fluctuation trend of stocks. A stock chart can be used to show fluctuations in temperature from day to day or year to year.
For more related knowledge, please visit the FAQ column!
The above is the detailed content of What are the chart types in excel?. For more information, please follow other related articles on the PHP Chinese website!
 Compare the similarities and differences between two columns of data in excel
 excel duplicate item filter color
 How to copy an Excel table to make it the same size as the original
 Excel table slash divided into two
 Excel diagonal header is divided into two
 Absolute reference input method
 java export excel
 Excel input value is illegal


