


redis_exporter prometheus grafana monitors Redis service indicators
This article uses redis_exporter prometheus grafana to monitor the Redis service. The reason is: low cost, less manual intervention, and direct downloading of the corresponding The components can communicate with each other simply by adding configurations, and the visual indicators are also relatively comprehensive.
Recommended (free):redis
The following is on a Linux machine with redis installed
1. redis_exporter
Download the program compressed file
wget https://github.com/oliver006/redis_exporter/releases/download/v0.28.0/redis_exporter-v0.28.0.linux-amd64.tar.gz
Unzip
tar zxf redis_exporter-v0.28.0.linux-amd64.tar.gz
cd into the directory
cd redis_exporter-v1.15.0.linux-amd64
Run the redis_exporter program directly Adding & means running in the background. The /redis_exporter & command accesses the localhost:6379 of the local machine by default. You need to specify the redis usage of other machines./redis_exporter ip:port &
./redis_exporter &
2, prometheus
The first step is to download the file as usual. The unzipped file (v2.7.1) can be modified to the version that needs to be installed. You can click https://github.com/prometheus/prometheus/releases to find the corresponding version. No.
wget https://github.com/prometheus/prometheus/releases/download/v2.7.1/prometheus-2.7.1.linux-amd64.tar.gz
tar zxf prometheus-2.7.1.linux-amd64.tar.gz
cd enters the directory and you will find a prometheus.yml configuration file. This configuration file corresponds to the service name, monitoring address and port of each service.
vim prometheus.yml
Open the configuration file and add the configuration of redis_exporter communication
- job_name: 'prometheus' static_configs: - targets: ['localhost:9090'] #程序在本机开通的端口号 默认9090 - job_name: 'redis' static_configs: - targets: - "IP:9121" #(安装redis_exporter的IP)
Run ps: Check if there is any process occupying port 9090
./prometheus &
http://ip:9090/targets Check if Success
3, grafana
No more nonsense
wget https://dl.grafana.com/oss/release/grafana-6.0.0-beta1.linux-amd64.tar.gz
tar zxf grafana-6.0.0-beta1.linux-amd64.tar.gz
cd grafana-6.0.0-beta1
./grafana-server start
After startup: http://ip:300 Default User: admin, password: admin Then find data sources on the left
Configure the Url corresponding to your program address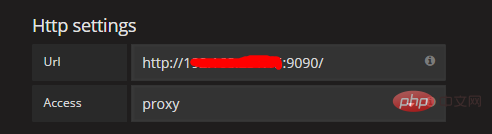
The last step! Download the json template Import
https://grafana.com/api/dashboards/763/revisions/1/download
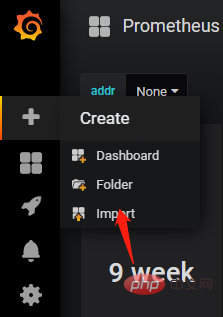
Upload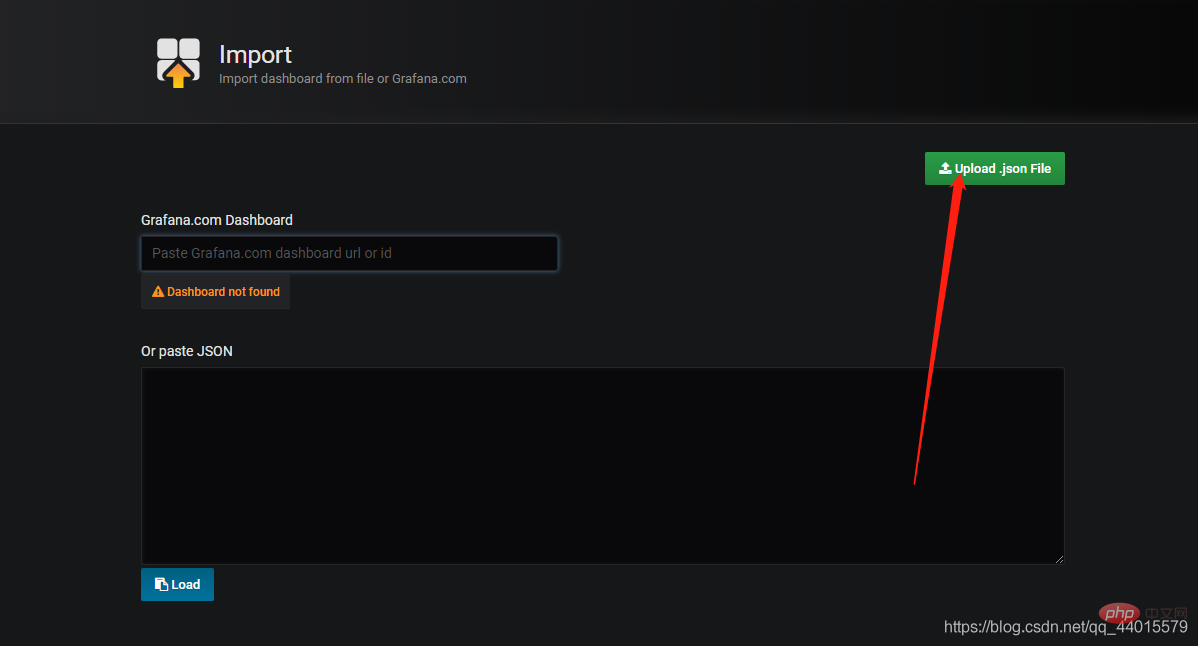
You can view it here Configure those service monitoring
Monitoring page


The above is the detailed content of Introducing Redis performance monitoring. For more information, please follow other related articles on the PHP Chinese website!
 Commonly used database software
 What are the in-memory databases?
 Which one has faster reading speed, mongodb or redis?
 How to use redis as a cache server
 How redis solves data consistency
 How do mysql and redis ensure double-write consistency?
 What data does redis cache generally store?
 What are the 8 data types of redis


![[Web front-end] Node.js quick start](https://img.php.cn/upload/course/000/000/067/662b5d34ba7c0227.png)


