##Related free learning recommendations:1 Common causes of log errors1.1 There are many log frameworksDifferent class libraries may use different log frameworks, and compatibility is a problem1.2 The configuration is complex and error-proneLog configuration files are usually very complicated. Many students are used to copying configuration files directly from other projects or online blogs, but do not study carefully how to modify them. Common errors occur in duplicate logging, performance of synchronous logging, and misconfiguration of asynchronous logging. 1.3 There are some misunderstandings in logging itselfFor example, the cost of obtaining log content is not considered, the log level is used indiscriminately, etc. 2 SLF4JLogback, Log4j, Log4j2, commons-logging, JDK’s own java.util.logging, etc. are all log frameworks of the Java system, and there are indeed many. Different class libraries may also choose to use different logging frameworks. As a result, unified management of logs becomes very difficult.
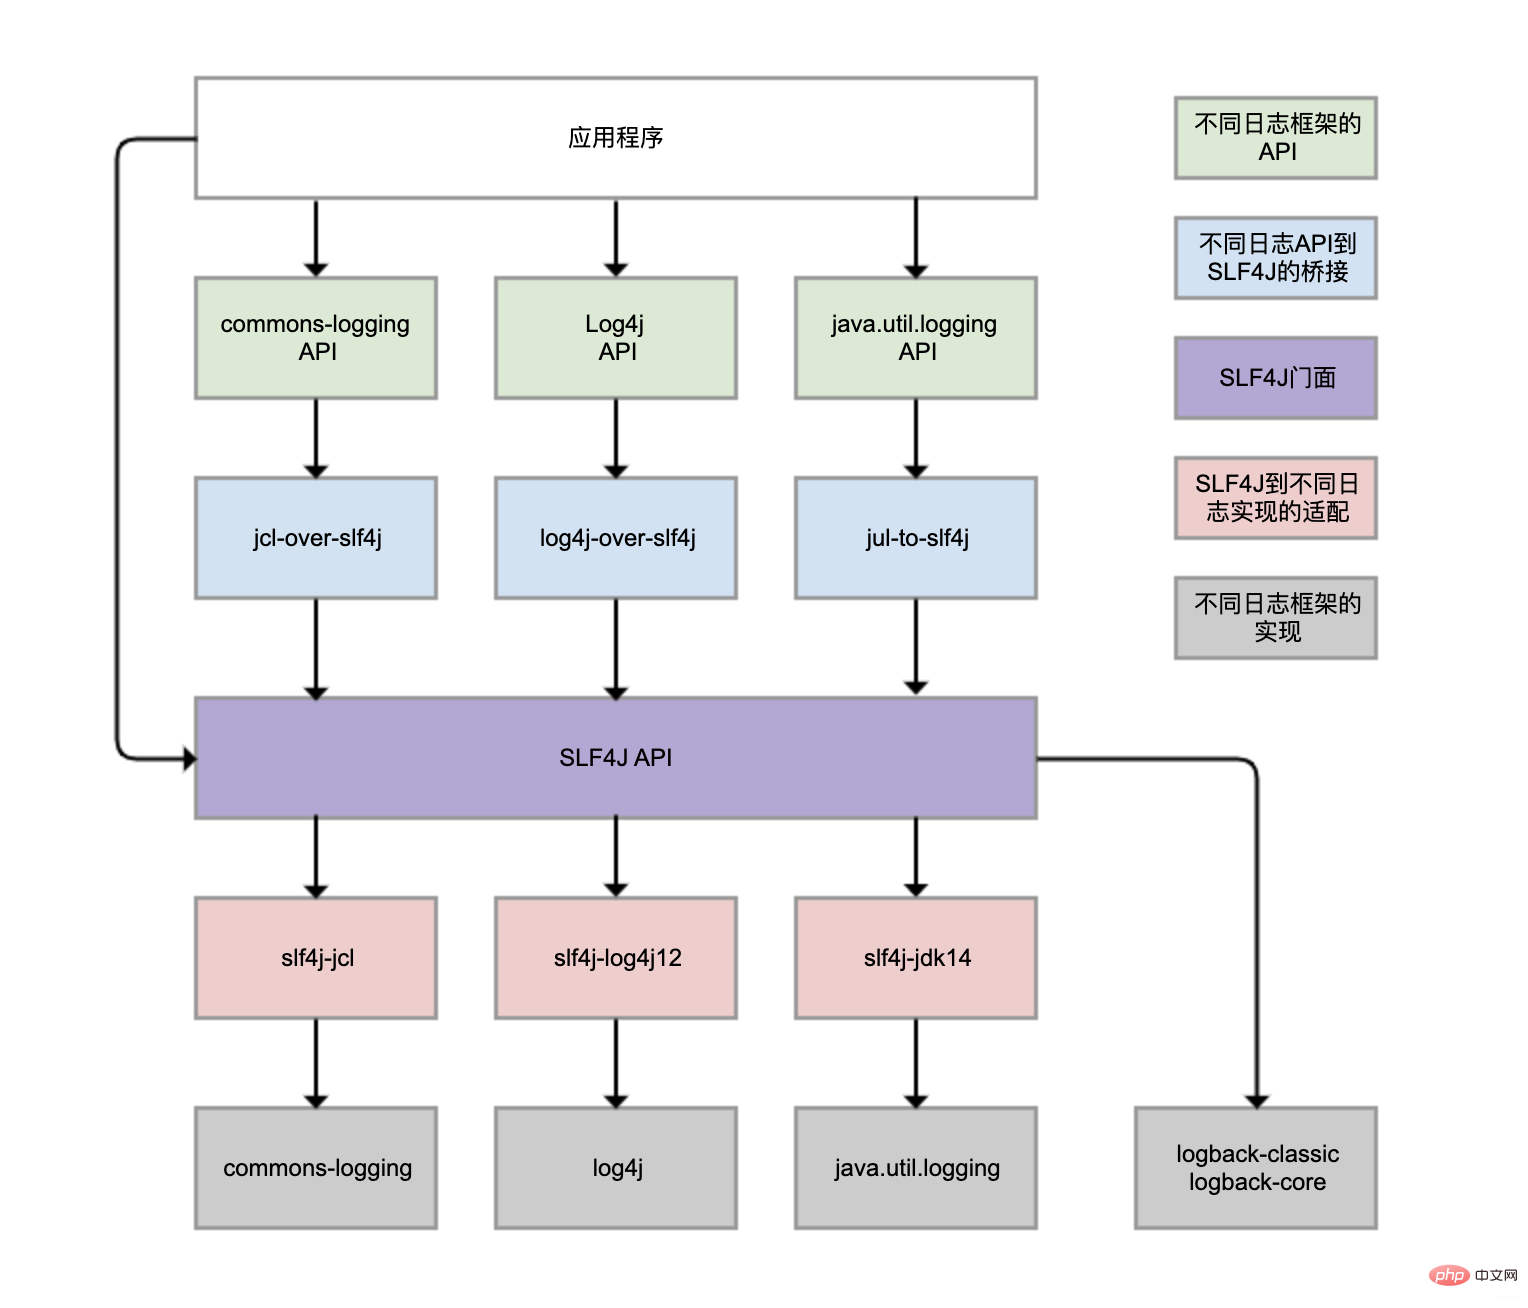
log4j-over-slf4j to implement Log4j bridging to SLF4J, you can also use slf4j-log4j12 to implement SLF4J adaptation to Log4j, and also use them A column is drawn, but it cannot use them at the same time, otherwise an infinite loop will occur. The same goes for jcl and jul.
spring-boot-starter-loggingModule
spring-boot-starter-loggingModule automatically introducedlogback -classic (contains SLF4J and Logback logging framework) and some adapters for SLF4J. Among them, log4j-to-slf4j is used to bridge the Log4j2 API to SLF4J, and jul-to-slf4j is used to bridge the java.util.logging API to SLF4J.
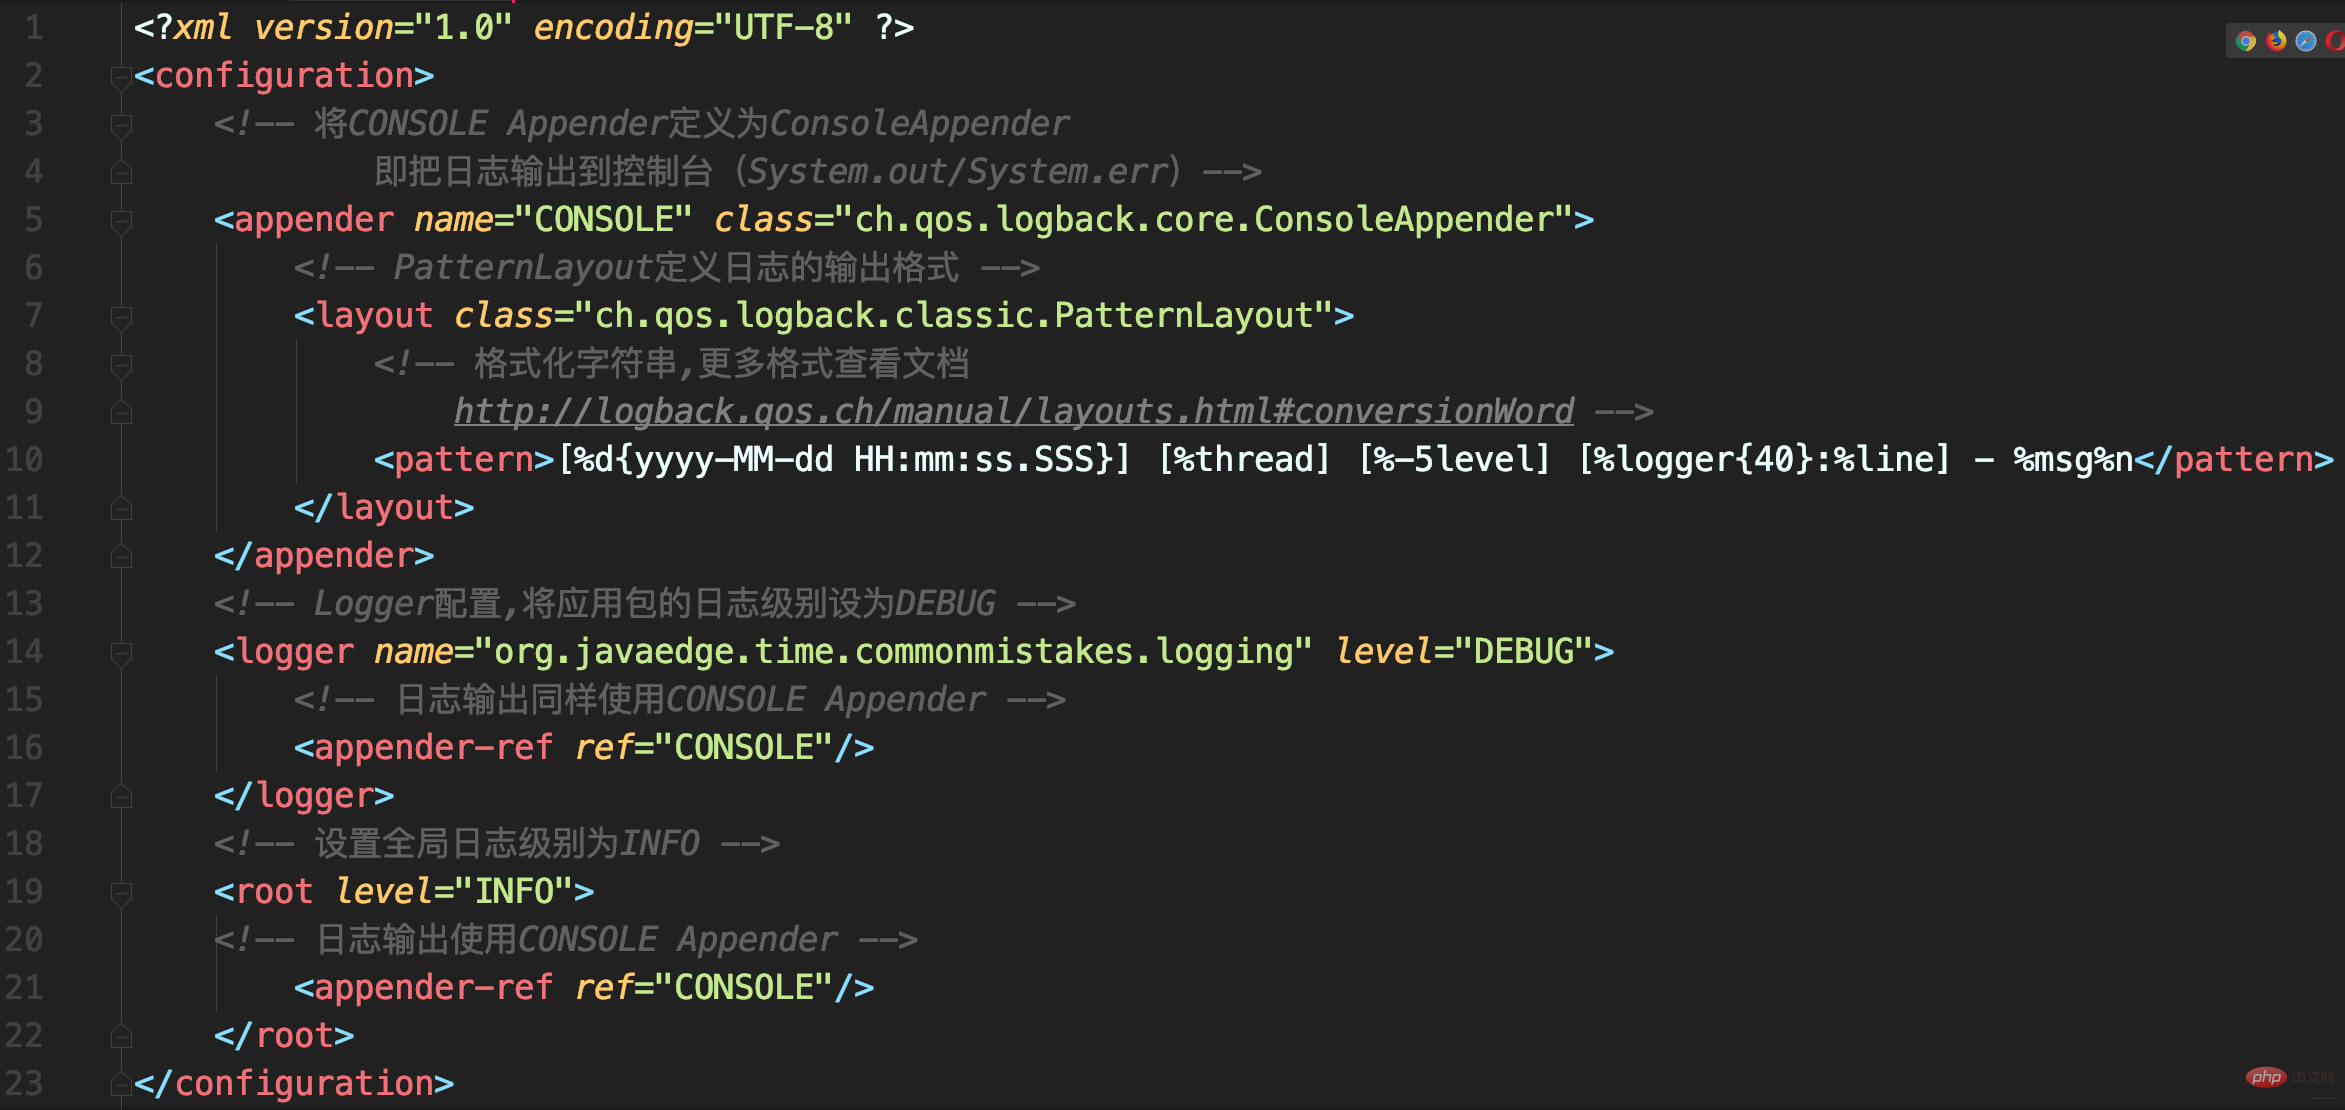

The Appender of CONSOLE is mounted to two Loggers at the same time, the defined and <root>, due to The defined is inherited from <root>, so the same log will be recorded through the logger and sent to the root record, so there will be duplicate records in the log under the application package. .
In my heart, I want to implement a custom logger configuration so that the logs in the application can temporarily enable DEBUG level logging. In fact, there is no need to mount the Appender repeatedly, just remove the Appender mounted under :
<logger name="org.javaedge.time.commonmistakes.logging" level="DEBUG"/>
you need to Log output to different Appenders: For example,
additivity attribute of <root> will not be inherited.
##
While recording logs to the console, log records are recorded to two files at different levels
Execution results
The info.log file contains INFO, WARN and ERROR three-level logs, which are not as expected
error.log contains WARN and ERROR level logs, resulting in repeated log collection
Some companies use automated ELK solutions to collect logs , the log will be output to the console and file at the same time. Developers will not care about the logs recorded in the file when testing locally. In test and production environments, because developers do not have server access rights, repeated problems in the original log file are difficult to find. .
returns NEUTRAL and continues to call the next filter on the filter chain

ThresholdFilter to WARN, so WARN and ERROR level logs can be recorded.
LevelFilter is used to compare log levels and then handle them accordingly.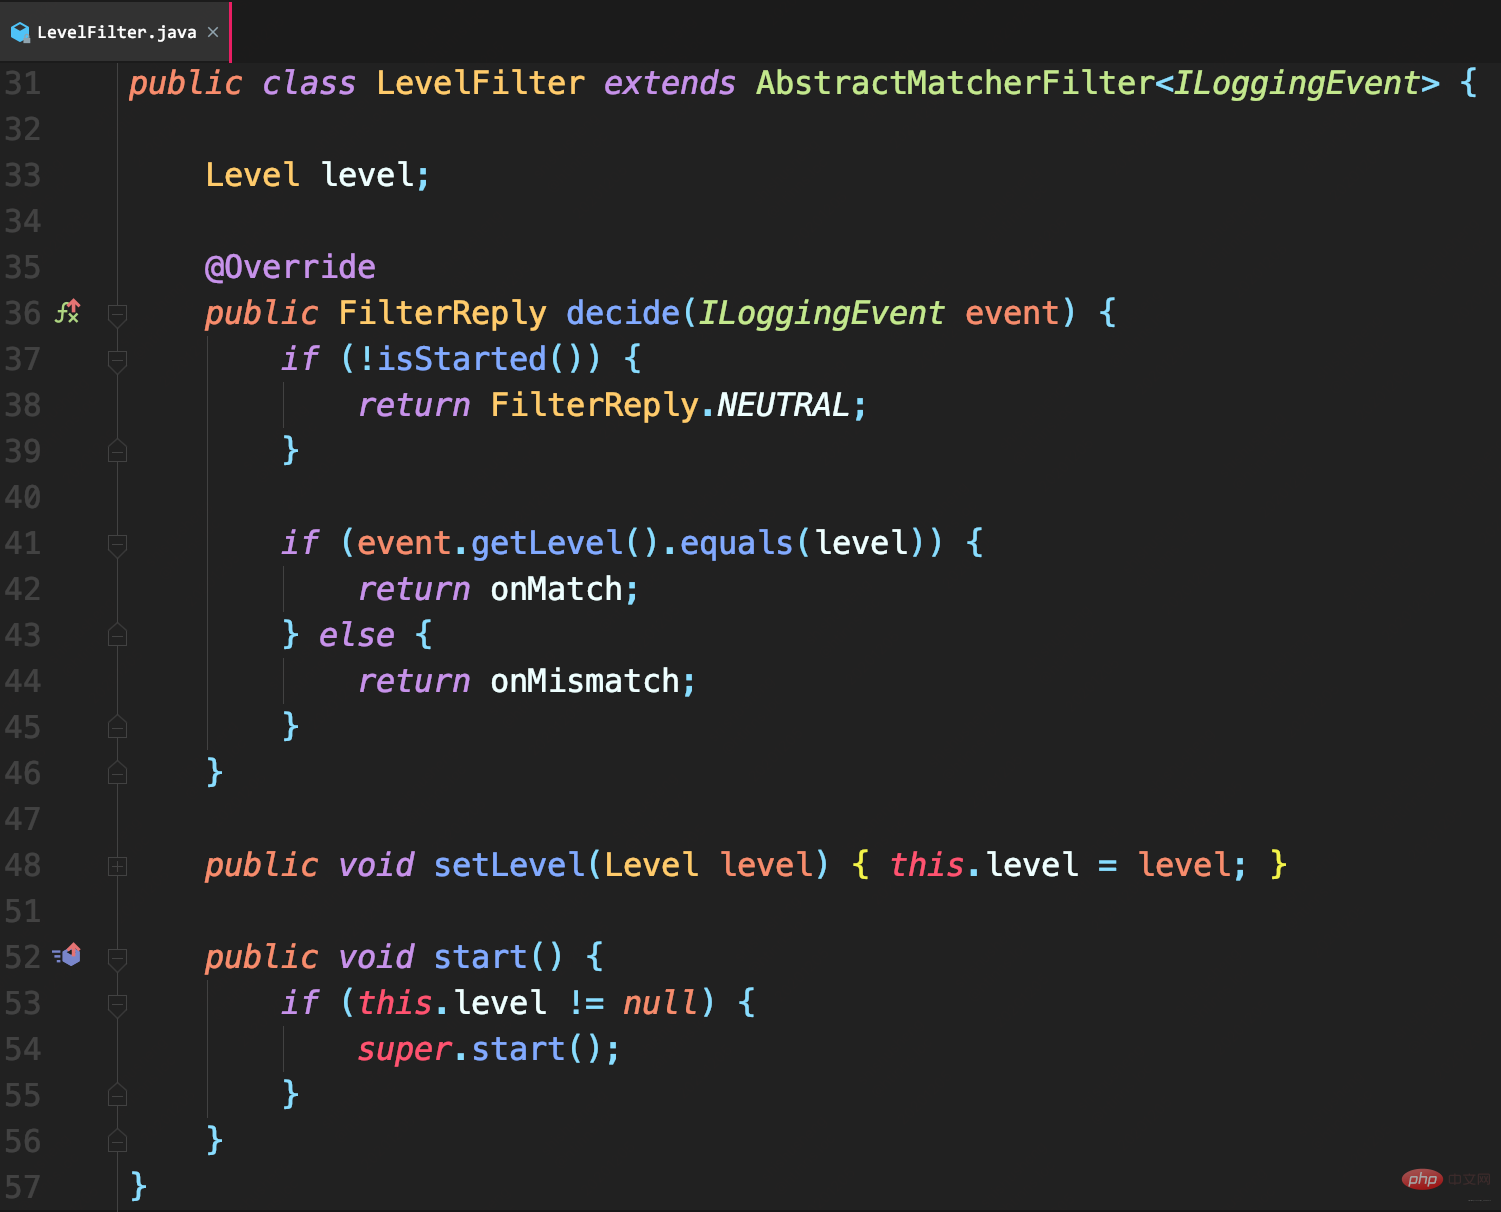

ThresholdFilter Different, LevelFilterOnly configuring level cannot really work.

_info.log file will only have INFO level logs, and there will be no duplicate logs.
CONSOLE is a ConsoleAppender used to record records with time Flagged logs. 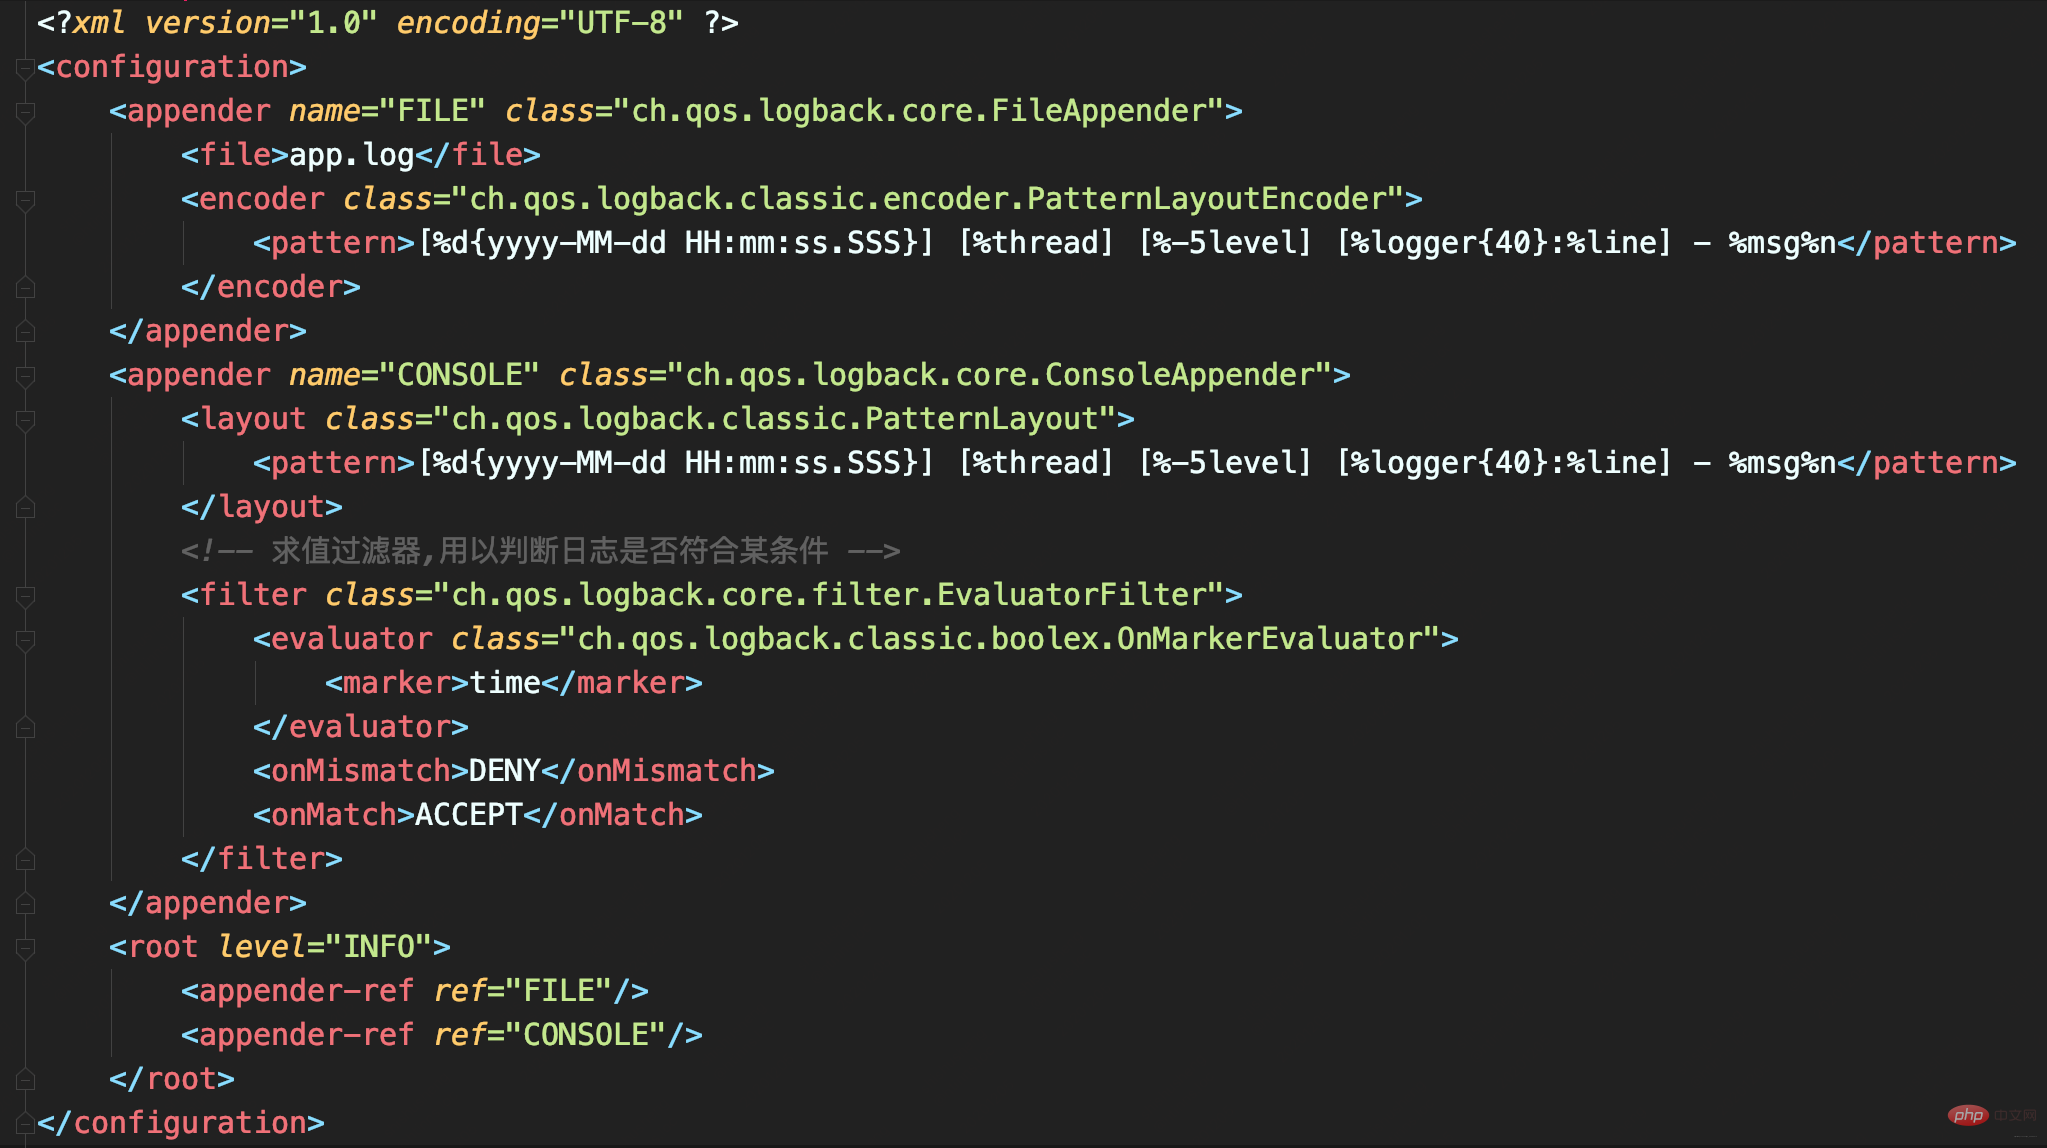 Output a large number of logs to a file. The log file will be very large. If the performance test results are also mixed in, it will be difficult to find that log. Therefore, EvaluatorFilter is used here to filter logs according to tags, and the filtered logs are output to the console separately. In this case, a time mark is added to the log that outputs the test results.
Use tags and EvaluatorFilter together to filter logs by tags.


 When appending logs, the logs are written directly into the OutputStream, which is a synchronous log recording
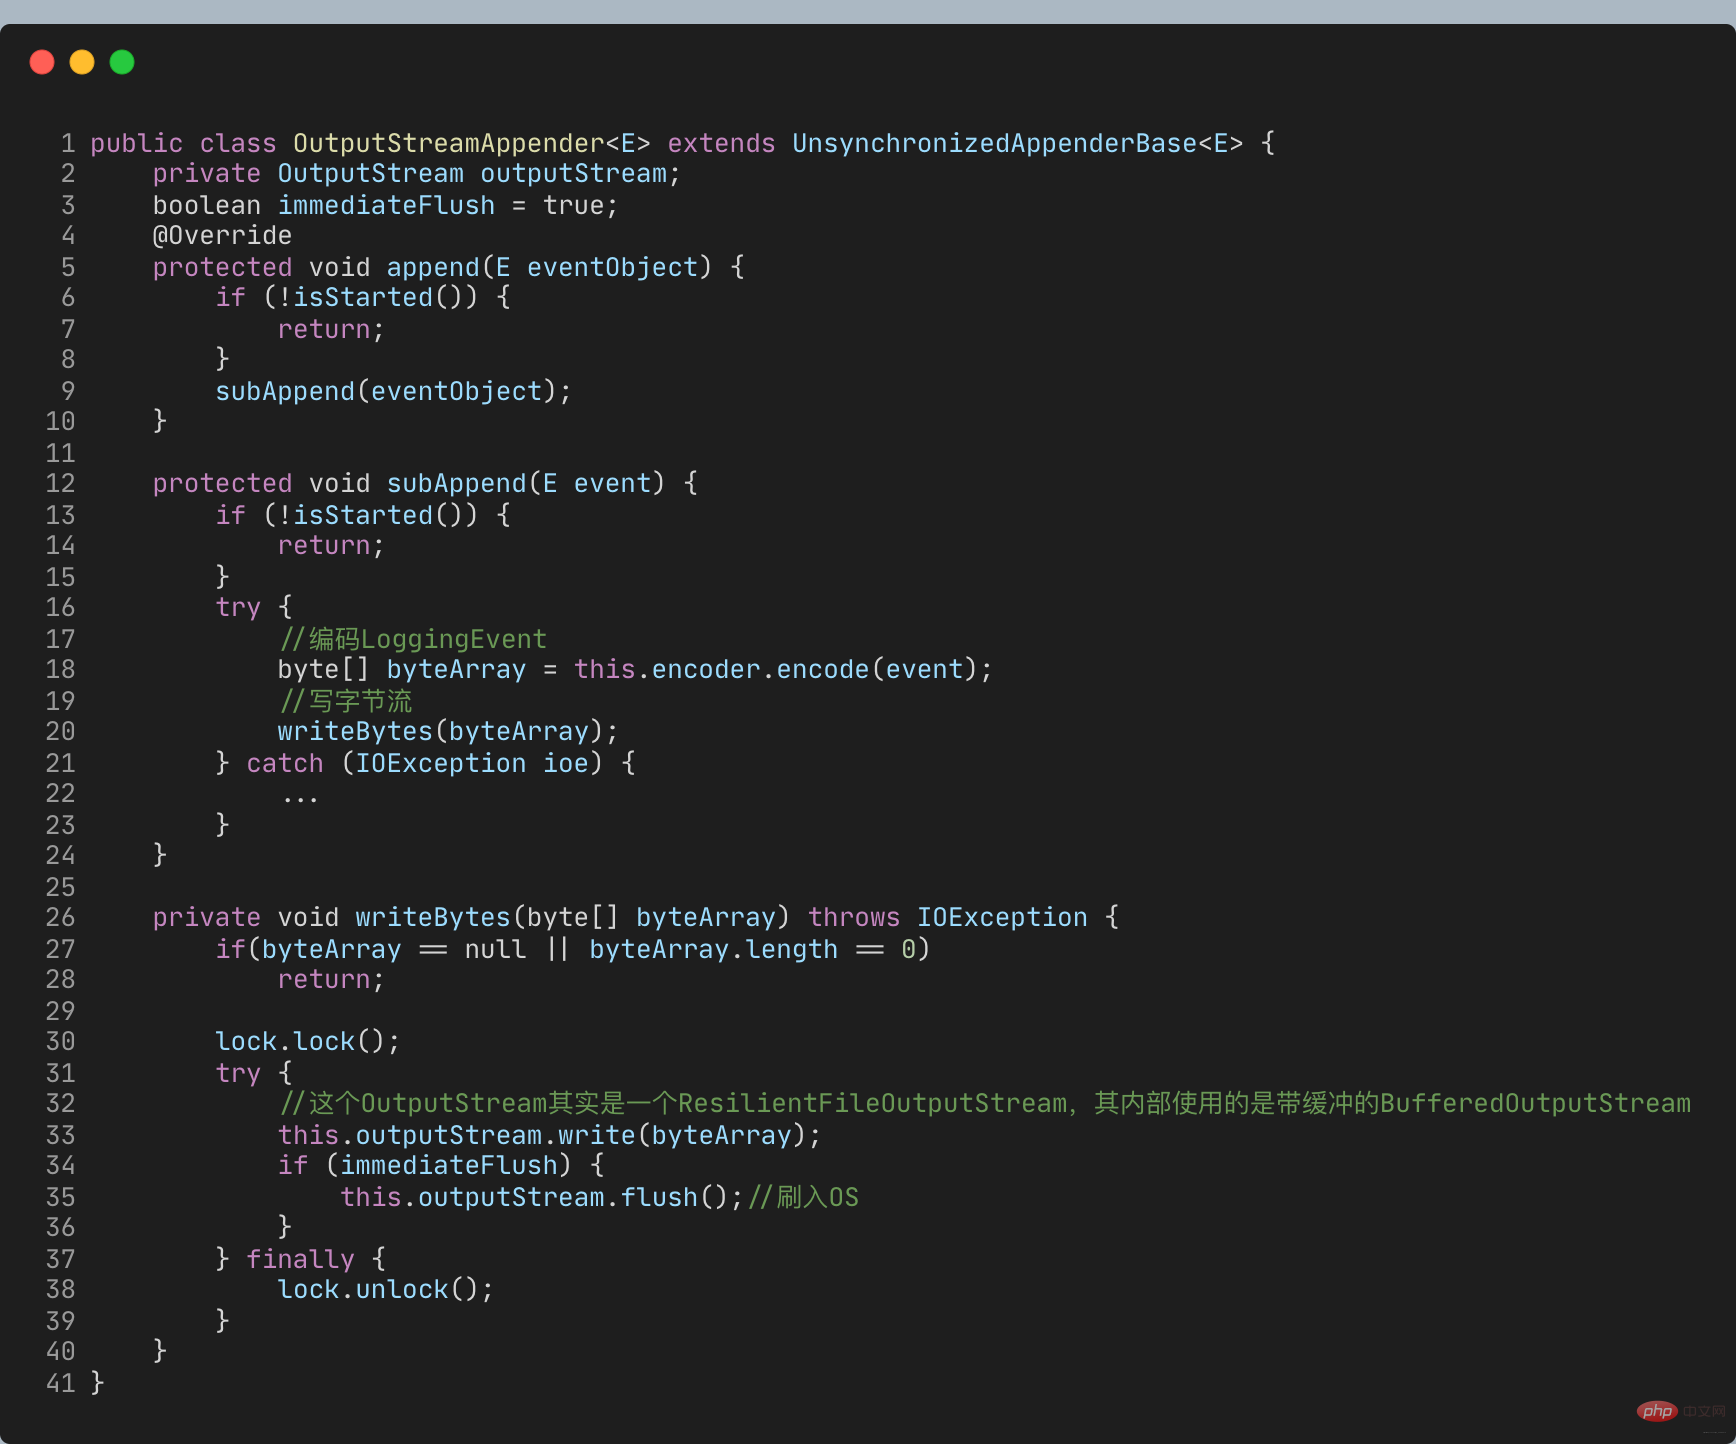
所以日志大量写入才会旷日持久。如何才能实现大量日志写入时,不会过多影响业务逻辑执行耗时而影响吞吐量呢?
使用Logback的AsyncAppender
即可实现异步日志记录。AsyncAppender类似装饰模式,在不改变类原有基本功能情况下为其增添新功能。这便可把AsyncAppender附加在其他Appender,将其变为异步。
定义一个异步Appender ASYNCFILE,包装之前的同步文件日志记录的FileAppender, 即可实现异步记录日志到文件


异步日志真的如此高性能?并不,因为这并没有记录下所有日志。
模拟慢日志记录场景:
首先,自定义一个继承自ConsoleAppender的MySlowAppender,作为记录到控制台的输出器,写入日志时休眠1秒。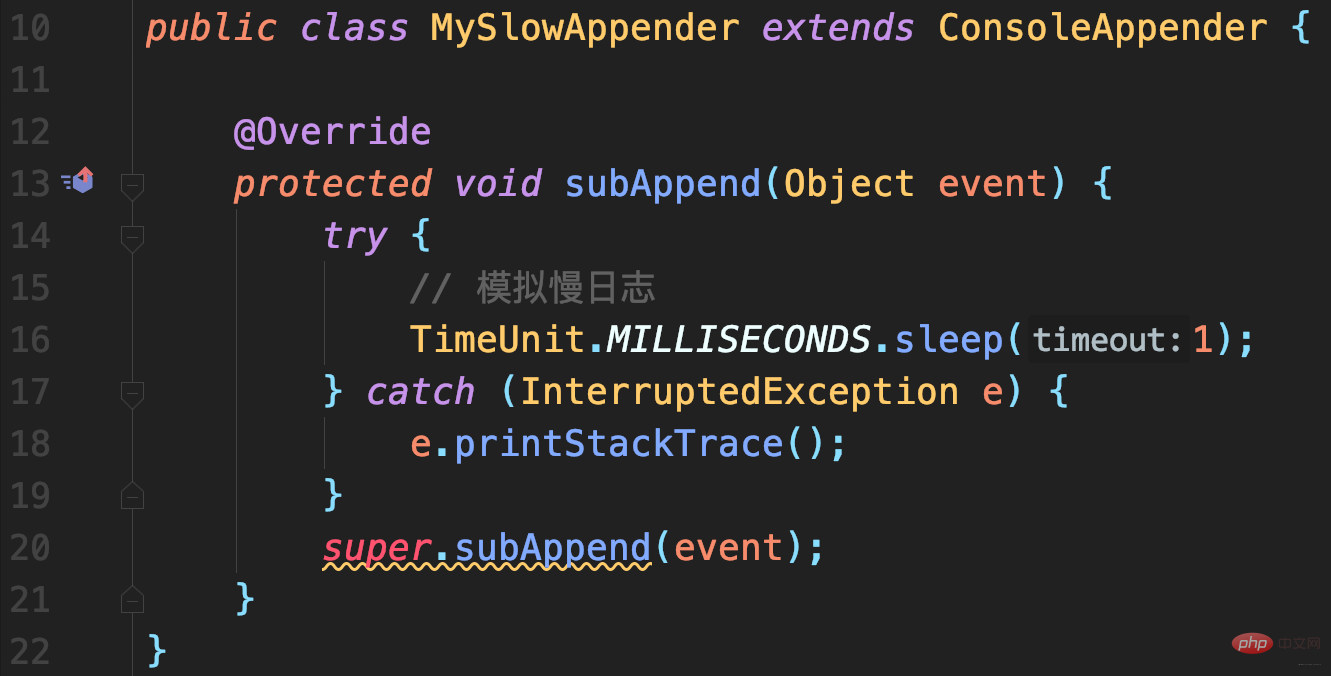
配置文件中使用AsyncAppender,将MySlowAppender包装为异步日志记录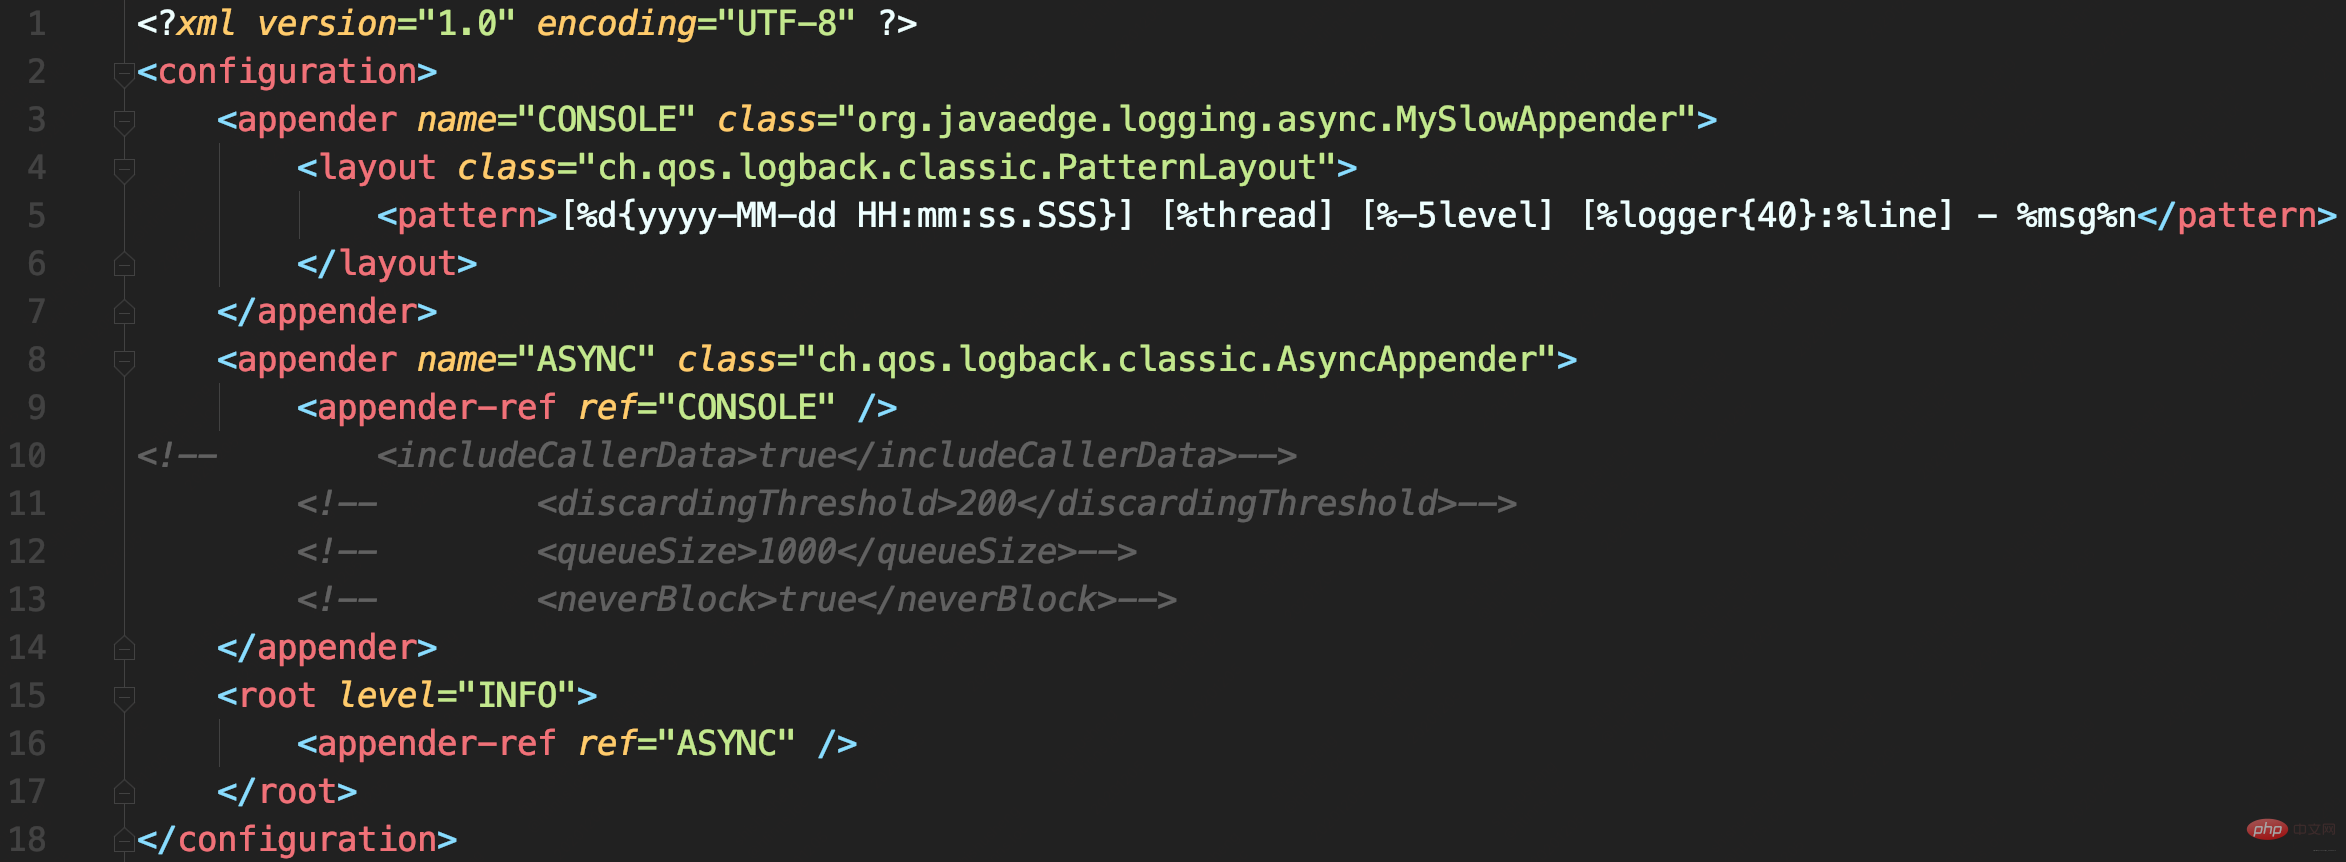
测试代码
耗时很短但出现日志丢失:要记录1000条日志,最终控制台只能搜索到215条日志,而且日志行号变问号。
原因分析
AsyncAppender提供了一些配置参数,而当前没用对。
队列剩余容量 < 队列长度的20%,就会丢弃TRACE、DEBUG和INFO级日志public class AsyncAppender extends AsyncAppenderBase<ILoggingEvent> {
// 是否收集调用方数据
boolean includeCallerData = false;
protected boolean isDiscardable(ILoggingEvent event) {
Level level = event.getLevel();
// 丢弃 ≤ INFO级日志
return level.toInt() <= Level.INFO_INT;
}
protected void preprocess(ILoggingEvent eventObject) {
eventObject.prepareForDeferredProcessing();
if (includeCallerData)
eventObject.getCallerData();
}}public class AsyncAppenderBase<E> extends UnsynchronizedAppenderBase<E> implements AppenderAttachable<E> {
// 阻塞队列:实现异步日志的核心
BlockingQueue<E> blockingQueue;
// 默认队列大小
public static final int DEFAULT_QUEUE_SIZE = 256;
int queueSize = DEFAULT_QUEUE_SIZE;
static final int UNDEFINED = -1;
int discardingThreshold = UNDEFINED;
// 当队列满时:加入数据时是否直接丢弃,不会阻塞等待
boolean neverBlock = false;
@Override
public void start() {
...
blockingQueue = new ArrayBlockingQueue<E>(queueSize);
if (discardingThreshold == UNDEFINED)
//默认丢弃阈值是队列剩余量低于队列长度的20%,参见isQueueBelowDiscardingThreshold方法
discardingThreshold = queueSize / 5;
...
}
@Override
protected void append(E eventObject) {
if (isQueueBelowDiscardingThreshold() && isDiscardable(eventObject)) { //判断是否可以丢数据
return;
}
preprocess(eventObject);
put(eventObject);
}
private boolean isQueueBelowDiscardingThreshold() {
return (blockingQueue.remainingCapacity() < discardingThreshold);
}
private void put(E eventObject) {
if (neverBlock) { //根据neverBlock决定使用不阻塞的offer还是阻塞的put方法
blockingQueue.offer(eventObject);
} else {
putUninterruptibly(eventObject);
}
}
//以阻塞方式添加数据到队列
private void putUninterruptibly(E eventObject) {
boolean interrupted = false;
try {
while (true) {
try {
blockingQueue.put(eventObject);
break;
} catch (InterruptedException e) {
interrupted = true;
}
}
} finally {
if (interrupted) {
Thread.currentThread().interrupt();
}
}
}}默认队列大小256,达到80%后开始丢弃<=INFO级日志后,即可理解日志中为什么只有两百多条INFO日志了。
可能导致OOM
默认值256就已经算很小了,且discardingThreshold设置为大于0(或为默认值),队列剩余容量少于discardingThreshold的配置就会丢弃<=INFO日志。这里的坑点有两个:
不是百分比,而是日志条数。对于总容量10000队列,若希望队列剩余容量少于1000时丢弃,需配置为1000意味总可能会出现阻塞。
queueSize、discardingThreshold和neverBlock三参密不可分,务必按业务需求设置:
neverBlock = true,永不阻塞discardingThreshold = 0,即使≤INFO级日志也不会丢。但最好把queueSize设置大一点,毕竟默认的queueSize显然太小,太容易阻塞。以上日志配置最常见两个误区
Let’s look at the misunderstandings in the log record itself.
SLF4J’s {} placeholder syntax will only obtain the actual parameters when the log is actually recorded, thus solving the problem of log Performance issues with data acquisition.
Is this correct?
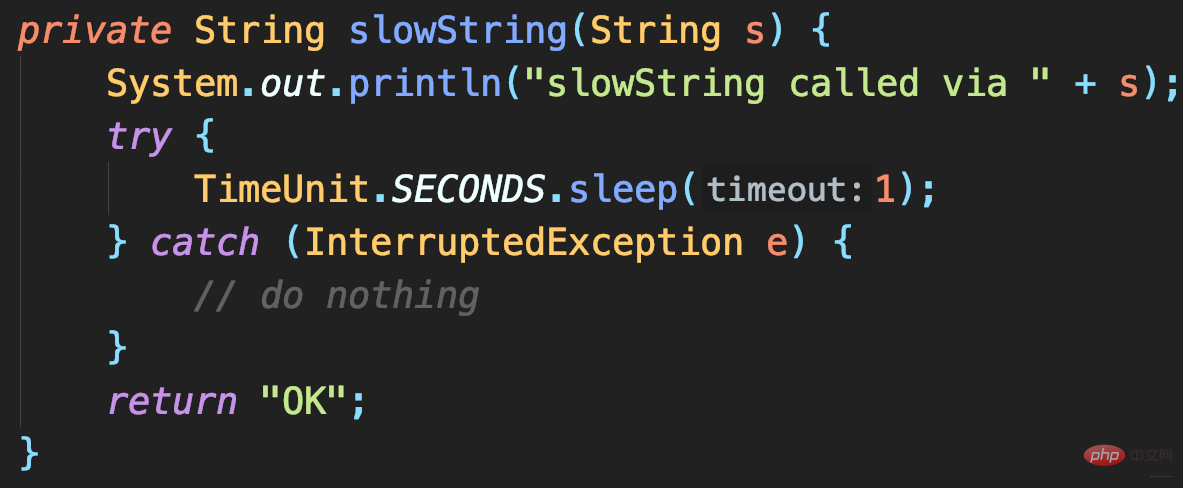
If DEBUG log is recorded, and set to record only>=INFO level Log, will the program also take 1 second?
Three methods to test:
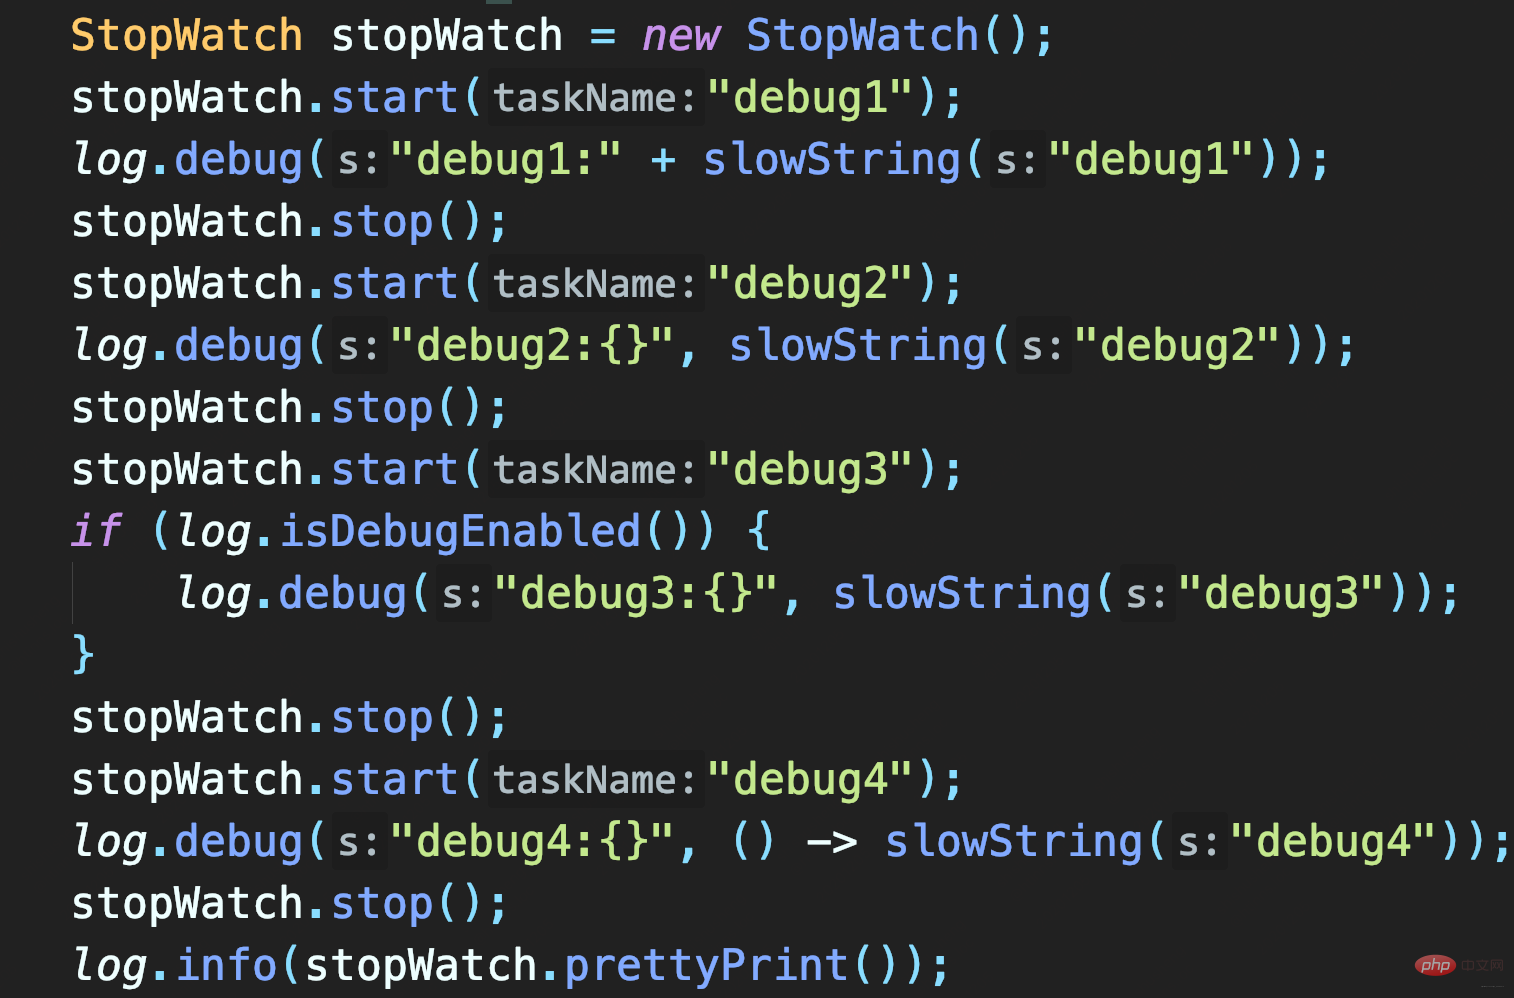
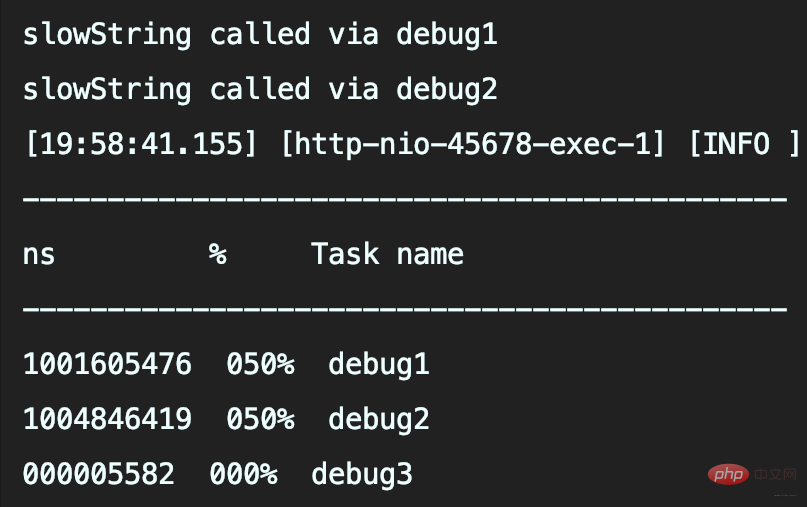
The first two methods call slowString, so they both take 1 second. And the second method is to use placeholders to record slowString. Although this method allows passing Object without explicitly splicing String, it is only a delay (if the log is not recorded, it will be omitted) Log parameter object.toString() and String concatenation takes time.
In this case, unless the log level is determined in advance, slowString must be called.
Therefore, using {} placeholder cannot solve the performance problem of log data acquisition by delaying parameter value acquisition.
In addition to judging the log level in advance, you can also obtain delayed parameter content through lambda expressions. However, SLF4J's API does not yet support lambda, so you need to use the Log4j2 log API and replace Lombok's @Slf4j annotation with the **@Log4j2** annotation to provide a method for lambda expression parameters: 
Call debug like this, signature Supplier, the parameters will be delayed until the log is actually needed to be obtained: 


So debug4 will not call the slowString method 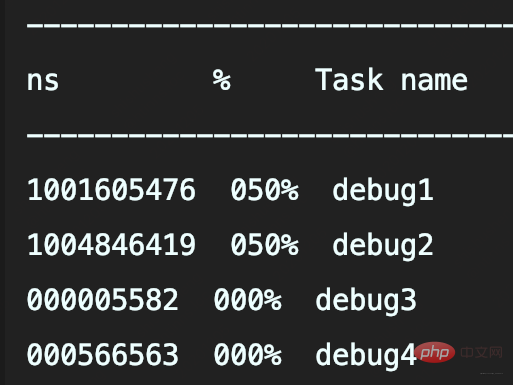
just replace it with Log4j2 API, the real logging is still through Logback, this is the benefit of SLF4J adaptation.
The above is the detailed content of Understand Java log levels, duplicate recording, and log loss issues. For more information, please follow other related articles on the PHP Chinese website!