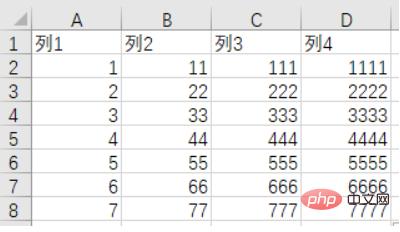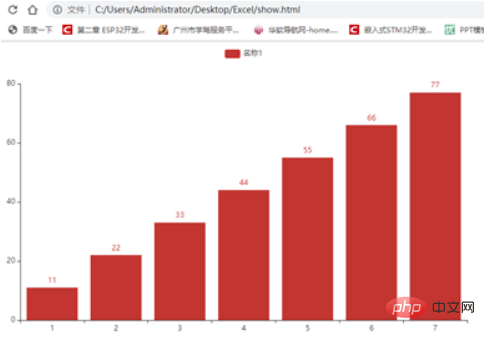
How to visualize excel data processing in python: first install the xlrd and xlwt libraries to read tables; then use pyecharts to generate the Echarts chart class library; finally install Echarts to read and display Excel data.

How to visualize excel data processing in python:
Excel table operation
Python mainly uses the two libraries xlrd and xlwt to operate excel, that is, xlrd is a library for reading excel, and xlwt is a library for writing excel.

Install xlrd
pip install xlrd
Simple table reading
import xlrd
#读取表格
data=xlrd.open_workbook("table.xlsx")
#获取表格的sheets
table=data.sheets()[0]
#输出行数量
print(table.nrows)#8
#输出列数量
print(table.ncols)#4
#获取第一行数据
row1data=table.row_values(0)
print(row1data)#['列1', '列2', '列3', '列4']
print(row1data[0])#列1Data visualization
pyecharts is a class library for generating Echarts charts. Echarts is a data visualization JS library open sourced by Baidu. The graph visualization effect generated by Echarts is very good. In order to connect with Python, it is convenient to directly use data to generate graphs in Python
Installation
pip install pyecharts
Read Excel Data and display

import xlrd
from pyecharts.charts import Bar
#读取表格
data=xlrd.open_workbook("table.xlsx")
#获取表格的sheets
table=data.sheets()[0]
#输出行数量
print(table.nrows)
#输出列数量
print(table.ncols)
#获取第一行数据
row1data=table.row_values(0)
print(row1data)#['列1', '列2', '列3', '列4']
print(row1data[0])#列1
xdata=[]
ydata=[]
for i in range(1,table.nrows):
    print(table.row_values(i))
    xdata.append(table.row_values(i)[0])
    ydata.append(table.row_values(i)[1])
print(xdata)
print(ydata)
#数据可视化,柱状图
bar=Bar()
bar.add_xaxis(xdata)
bar.add_yaxis("名称1",ydata)
bar.render("show.html")Related free learning recommendations: python video tutorial
The above is the detailed content of How to visualize excel data processing in python. For more information, please follow other related articles on the PHP Chinese website!