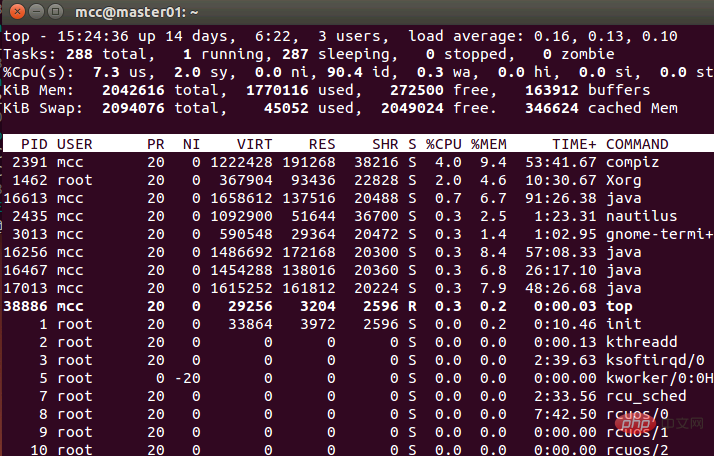
Use the top command to check cpu usage under Linux. The top command is a commonly used performance analysis tool under Linux. It can display the resource usage of each process in the system in real time, similar to the task manager under Windows.

#The top command is a commonly used performance analysis tool under Linux. It can display the resource usage of each process in the system in real time, similar to the Windows Task Manager.
(Recommended tutorial: linux video tutorial)
After running the top command, the CPU usage status will be displayed in full screen and will be in conversation mode-- Using top-based commands, you can control the display mode and so on. The command to exit top is q (press the q key once while top is running).

Content explanation:
First line (top):
15:24:36 System current time
14 days The operating time since the system started until now
3 users Users currently logged in to the system, more precisely, the number of terminals logged in to the user - the same user's access to multiple terminals in the system at the same time The connection will be regarded as multiple users connecting to the system. The number of users here will also be expressed as the number of terminals
Load average is the average value of the current system load. The next three values are 1 minute ago, 5 The average number of processes minutes ago and 15 minutes ago. Generally speaking, it can be considered that when this value exceeds the number of CPUs, the CPU will have a difficult load on the processes included in the current system
Second line (Tasks):
288 total Total number of current system processes
1 running Number of processes currently running
287 sleeping Number of processes currently in waiting state
0 stoped Stopped Number of system processes
0 zombie Number of zombie processes
The third line (Cpus):
7.3% us User space occupied CPU percentage
2.0% sy Kernel space occupied CPU percentage
0.0% ni Percentage of CPU occupied by processes that have changed priorities in the user process space
90.4% id Idle CPU percentage
0.3% wa Percentage of CPU time waiting for input and output
0.0% hi
0.0% si
0.0% st
The fourth line (Mem):
2042616 total total physical memory
1770116 used The total amount of physical memory used
272500 free Total amount of free memory
163912 buffers The amount of memory used as kernel cache
The fifth line (Swap):
indicates the same category as the fourth line (Mem ), but this reflects the usage of swap partition (Swap). Usually, frequent use of the swap partition (Swap) will be regarded as caused by insufficient physical memory.
2094076 total Total amount of swap area
45052 used Total amount of swap area used
2049024 free Total amount of free swap area
346624 cached Total amount of buffered swap area
The process list column at the bottom:
The process list distinguished by PID will be updated regularly according to the set screen update time. The display mode here can be controlled through the top internal command:
PID: ID of the process
USER: Process owner
PR: Priority level of the process, the smaller the priority, the more priority it will be executed
NInice: value
VIRT: virtual memory occupied by the process
RES: physical memory occupied by the process
SHR: shared memory used by the process
S: status of the process. S means sleeping, R means running, Z means zombie state, N means the priority value of the process is negative
%CPU: CPU usage occupied by the process
%MEM: The percentage of physical memory and total memory used by the process
TIME: The total CPU time occupied by the process after it is started, that is, the accumulated value of the CPU usage time.
COMMAND: Process startup command name
Related recommendations: linux tutorial
The above is the detailed content of What command to use to check cpu usage in linux. For more information, please follow other related articles on the PHP Chinese website!