
1. Open the Chrome remote debugging port
First we need to start Chrome with remote debugging turned on so that VS Code can attach to on Chrome.
Windows
Right-click the Chrome shortcut icon, select Properties in the target column, and finally add --remote-debugging-port=9222, be sure to separate them with spaces
macOS
Open the console
Execute the command/Applications/Google\ Chrome.app /Contents/MacOS/Google\ Chrome --remote-debugging-port=9222
Linux
Open the console to execute the commandgoogle-chrome --remote-debugging-port=9222
2. Install the Chrome Debug plug-in
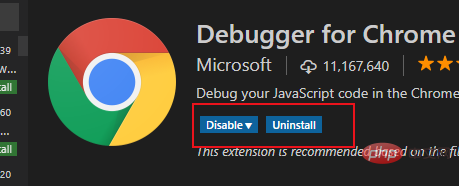
Click the extension button in the left sidebar of Visual Studio Code, and then search Enter Debugger for Chrome in the box and install the plug-in, then enter it again. After the installation is complete, click reload to restart.

#3. Create a Debug configuration file
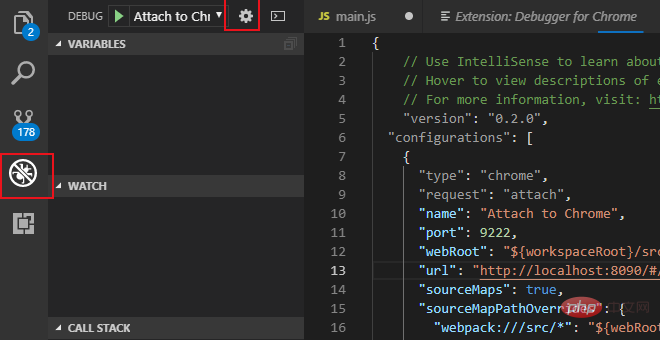
Click the Debug button in the left sidebar of Visual Studio Code, and in the pop-up debug configuration window Click the Settings gear, then select chrome, VS Code will generate a .vscode directory in the root directory of the workspace. There will be a lanch.json file in it and it will automatically open
Use the following configuration file to override the automatic generation lanch.json file contents.
Note: The port number in the URL must be consistent with the startup port number configured by WEBPACK.
{
  // Use IntelliSense to learn about possible attributes.
  // Hover to view descriptions of existing attributes.
  // For more information, visit: https://go.microsoft.com/fwlink/?linkid=830387
  "version": "0.2.0",
  "configurations": [
    {
      "type": "chrome",
      "request": "attach",
      "name": "Attach to Chrome",
      "port": 9222,
      "webRoot": "${workspaceRoot}/src",
      "url": "http://localhost:8080/#/",
      "sourceMaps": true,
      "sourceMapPathOverrides": {
        "webpack:///src/*": "${webRoot}/*"
      }
    }
  ]
}
4. Modify the webpack configuration
If it is a vue project packaged based on webpack, there may be breakpoint mismatches Question, some modifications are needed:
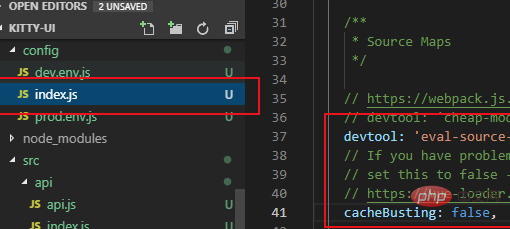
(1) Open the index.js file in the config directory under the root directory
(2) Change the devtool value under the dev node to 'eval -source-map'
(3) Change the cacheBusting value under the dev node to false

##5. Turn on debugging
After the above configuration is completed: (1) Open Chrome with remote debugging in the first step(2) Execute npm run dev in the vue project Start the project in debugging mode (3) Click the debug button on the left sidebar of VS Code, select Attach to Chrome and click the green start button. The debugging control bar will appear under normal circumstances. Now you can debug breakpoints in the js code of the vue file. Recommended related articles and tutorials:The above is the detailed content of How to debug vscode with breakpoints. For more information, please follow other related articles on the PHP Chinese website!


