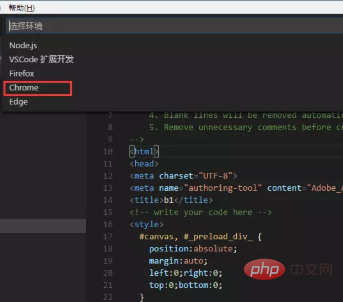

Search for Debugger for Chrome in the extensions on the left and click to install

Click f5 under your html project directory, or Select the debug button

# on the left and select the drop-down button. There will be an add. It will appear after selecting chrome

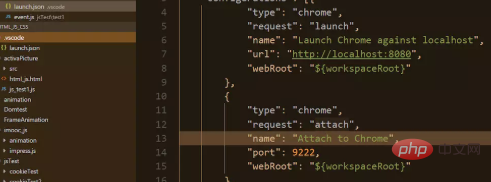
The configuration file of laungh.json is under your own project directory

#However, if you want to debug different code files, you need to modify the configuration file every time
{
    "version": "0.2.0",
    "configurations": [{
            "type": "chrome",
            "request": "launch",
            "name": "Launch Chrome against localhost",
            "url": "http://localhost:8080",
            "webRoot": "${workspaceRoot}"
        },
        {
            "type": "chrome",
            "request": "attach",
            "name": "Attach to Chrome",
            "port": 9222,
            "webRoot": "${workspaceRoot}"
        },
        {
            "name": "Launch index.html (disable sourcemaps)",
            "type": "chrome",
            "request": "launch",
            "sourceMaps": false,
            "file": "${workspaceRoot}/jsTest/test1/test1.html"  #每次需要修改这里的文件地址
        }
    ]
}Here you can debug, select the Launch index.html (disable sourcemaps) debugging item in


The above is the detailed content of How to debug js code in vscode. For more information, please follow other related articles on the PHP Chinese website!


