
go has the pprof package for code performance monitoring. There are packages in two places:
net/http/pprof
runtime/pprof
In fact, net/http/pprof just uses the runtime/pprof package to encapsulate it and expose it on the http port
pprof package
Web server
If your go program is a web server started with the http package, you want to check the status of your web server. At this time, you can choose net/http/pprof. You just need to import the package_"net/http/pprof".
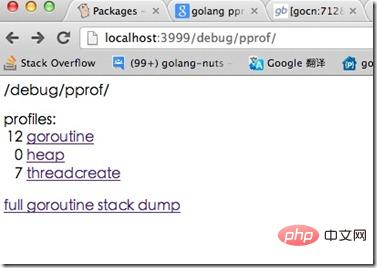
Then you can use http://localhost:port/debug/pprof/ in the browser to directly see the status of the current web service, including CPU usage and memory usage. For specific usage, you can read godoc's instructions.
Service process
If your go program is not a web server, but a service process, then you can also choose to use the net/http/pprof package, which is also introduced Package net/http/pprof, and then open another goroutine to enable port monitoring.
For example:
go func() {
        log.Println(http.ListenAndServe("localhost:6060", nil))
}()Application
If your go program is just an application, such as calculating the fabonacci sequence, then you cannot use net /http/pprof package, you need to use runtime/pprof. The specific method is to use pprof.StartCPUProfile and pprof.StopCPUProfile. For example, the following example:
var cpuprofile = flag.String("cpuprofile", "", "write cpu profile to file")

func main() {
    flag.Parse()
    if *cpuprofile != "" {
        f, err := os.Create(*cpuprofile)
        if err != nil {
            log.Fatal(err)
        }
        pprof.StartCPUProfile(f)
        defer pprof.StopCPUProfile()
    }
…When running the program, add a --cpuprofile parameter, such as fabonacci --cpuprofile=fabonacci.prof
In this way, the cpu information when the program is running will be recorded XXX.prof is hit.
The next step is to use this prof information to make performance analysis graphs (graphviz needs to be installed).
Use go tool pprof (application) (application prof file)
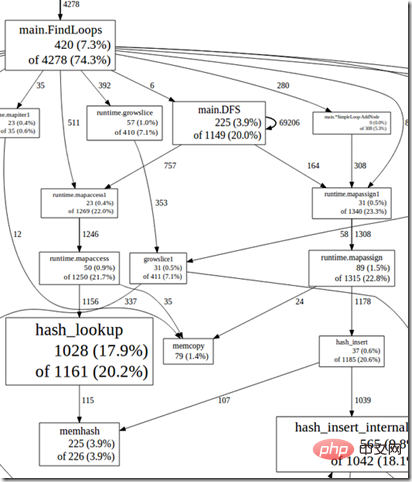
Enter pprof and use the web command to generate the svg file under /tmp. The svg file can be browsed Viewed under the device. Like this:

#If your program is very simple, for example, there is only one println statement, you will not be able to print anything using pprof.StartCPUProfile.
Example
Let’s take go-tour as an example. This is a web program. I added
_ "net/http /pprof"
I can directly view the prof information in the browser

Generate CPU status analysis graph
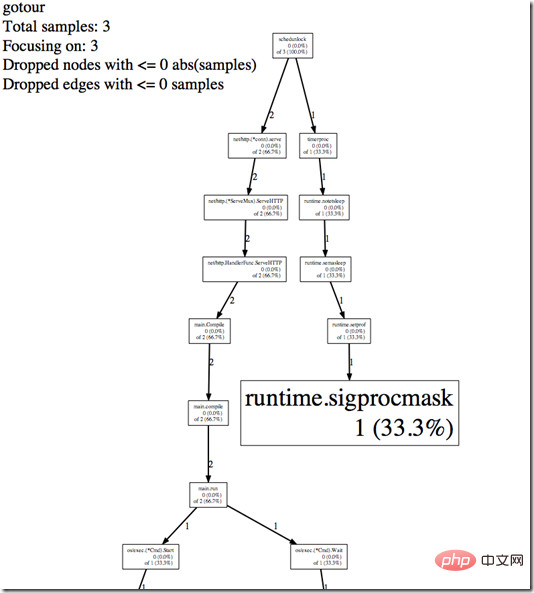
Next we want to generate a CPU status analysis chart. Call go tool pprof http://localhost:3999/debug/pprof/profile
and it will enter the 30-second profile collection time. During this event Refresh the page on the go-tour browser and try to use the CPU to generate data.
(pprof) top10
Total: 3 samples
       1 33.3% 33.3% 1 33.3% MHeap_AllocLocked
       1 33.3% 66.7% 1 33.3% os/exec.(*Cmd).closeDescriptors
       1 33.3% 100.0% 1 33.3% runtime.sigprocmask
       0 0.0% 100.0% 1 33.3% MCentral_Grow
       0 0.0% 100.0% 2 66.7% main.Compile
       0 0.0% 100.0% 2 66.7% main.compile
       0 0.0% 100.0% 2 66.7% main.run
       0 0.0% 100.0% 1 33.3% makeslice1
       0 0.0% 100.0% 2 66.7% net/http.(*ServeMux).ServeHTTP
       0 0.0% 100.0% 2 66.7% net/http.(*conn).serve
(pprof)web

For more go language knowledge, please pay attention to the go language tutorial column.
The above is the detailed content of Completely master how to use pprof in Go. For more information, please follow other related articles on the PHP Chinese website!