

First, you must first install the xdebug extension for php
1, download xdebug, and the download will be completed The final file is placed in the ext directory under the PHP installation path. The PHP5.5 installation package has a zend_ext directory by default. You can also place it in this directory. Remember the installation path later (recommended learning: phpstorm Detailed explanation)
(D:\root\wamp\bin\php\php5.5.12\ext\php_xdebug-2.2.5-5.5-vc11.dll或D:\wamp\bin\php\php5.5.12\zend_ext\php_xdebug-2.2.5-5.5-vc11.dll)
2. Modify php.ini and associate xdebug to make xdebug take effect
;XDEBUG Extension
zend_extension = "D:/wamp/bin/php/php5.5.12/zend_ext/php_xdebug-2.2.5-5.5-vc11.dll"
;将xdebug的扩展路径添加到这里(步骤一中的路径,根据你的xdebug放置的路径来确定。)
[xdebug]
xdebug.remote_enable = on  #开启xdebug的调试
xdebug.remote_port = 9001  #xdebug调试侦听的端口
xdebug.remote_host = localhost #本地的侦听的主机
xdebug.idekey = phpstorm  #用IDE协助时需要的key
3. Check whether the configuration is correct by accessing phpinfo

2, Phpstorm related configuration
1, basic debug settings, click File->Settings on the menu bar, open the dialog box, the drop-down menu Languages on the left & Frameworks -> PHP -> Debug setting
is mainly to configure the Debug port: 9001. Select 9001 to prevent the 9000 port from being occupied.
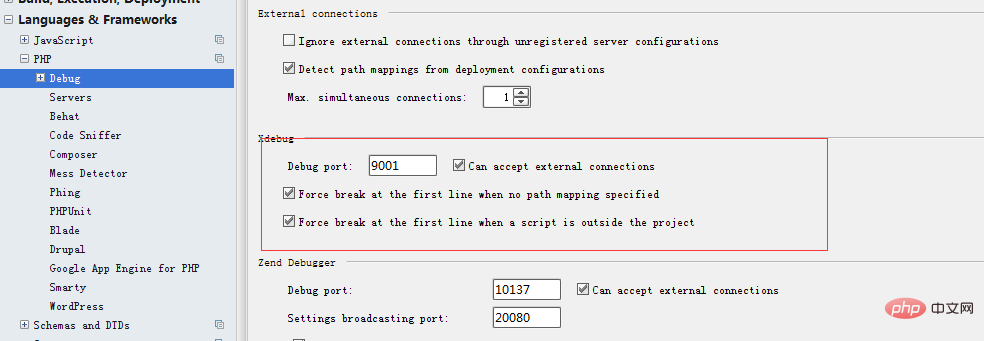 2, open Debug->DBGp proxy, and add the configuration items in php.ini here.

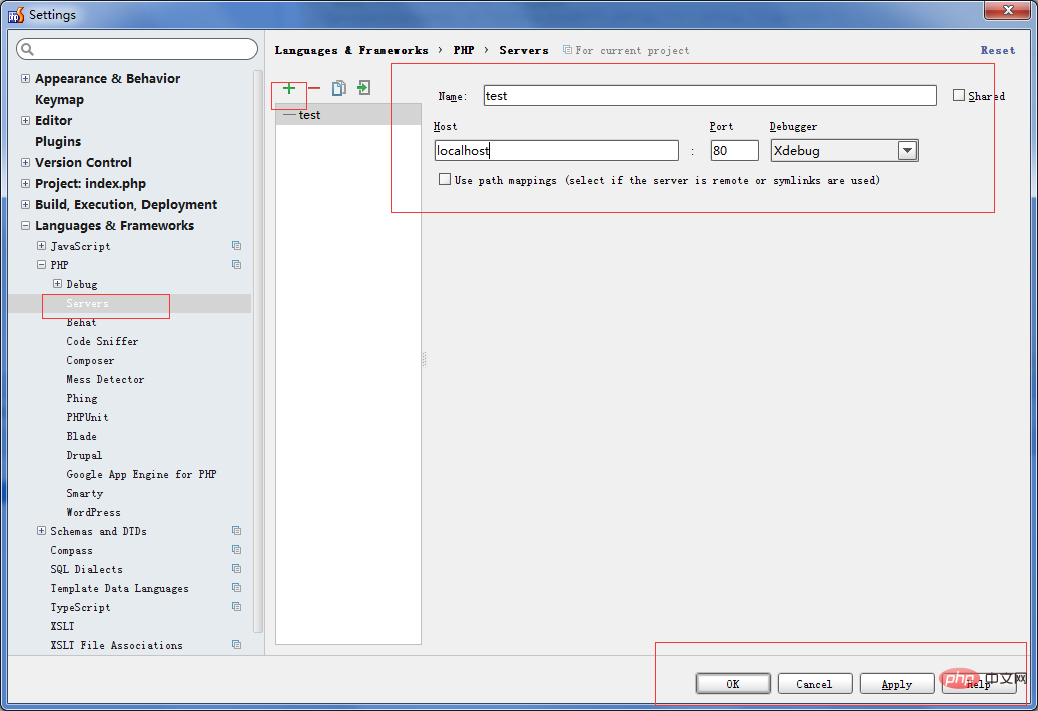
3. Create a new php server, change the name to test, Host: localhost, port: 80, Debugger: Xdebug, save.
This server is reserved for later configuration of specific debugging.
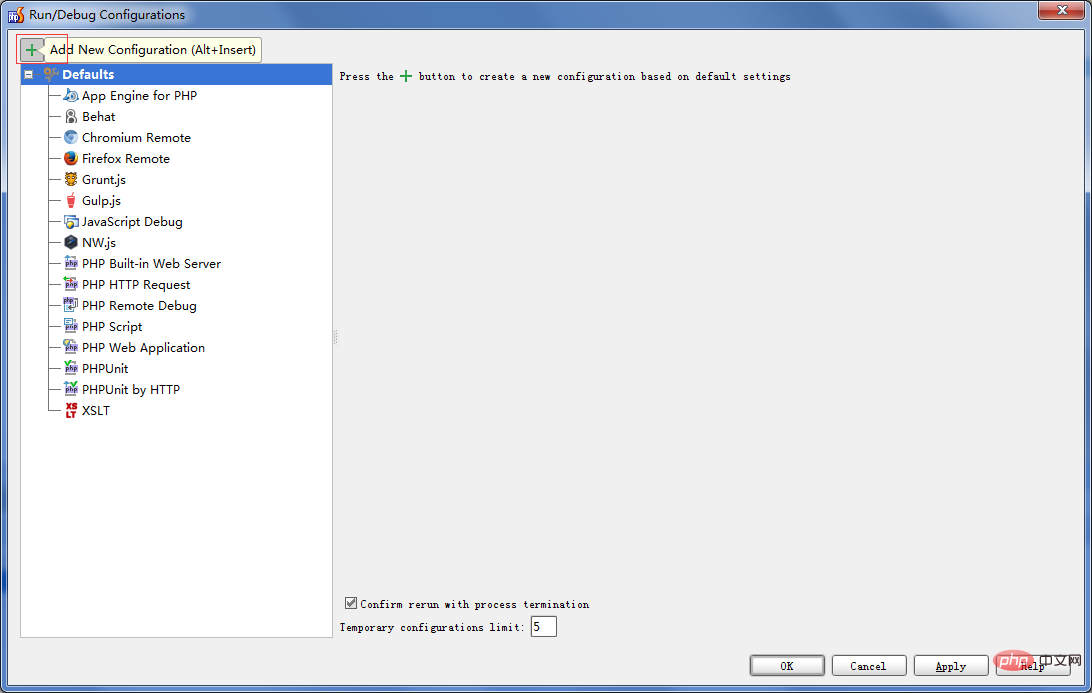
4. For the Debug settings of the project, click Run->Edit configurations.. in the menu bar to open the dialog box
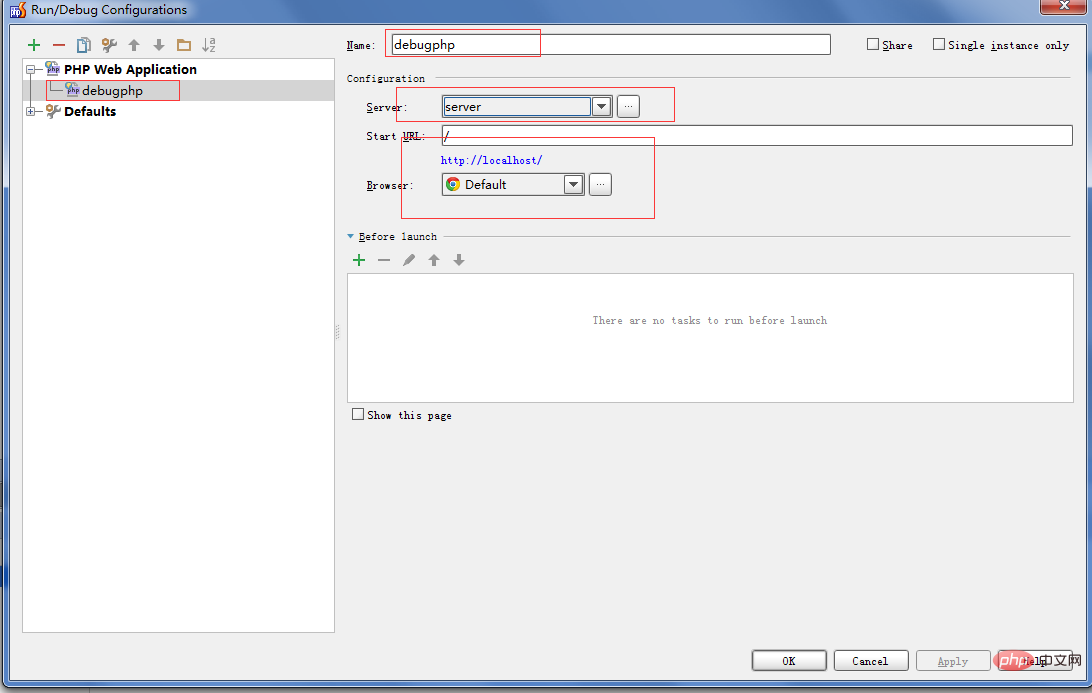
1 ), add a new debug configuration, and currently select a new server for the php project (the server configured in step 3 is sufficient)
 The new debug can be named name:debugphp , server: Select the server we just configured
start Url: The default directory is, of course, you can add
at will. Browser: Select the browser you think is appropriate.
Three, start debugging
1, add breakpoints, open a PHP file in the root directory, Select any line in the php file and right-click to add a breakpoint, or click on the header of the line.

2, shift F9 or click the spider on the right side of the menu bar

3, Phpstorm The browser will be opened, the program will be executed, and the debugging point will be captured. Return to the debug interface
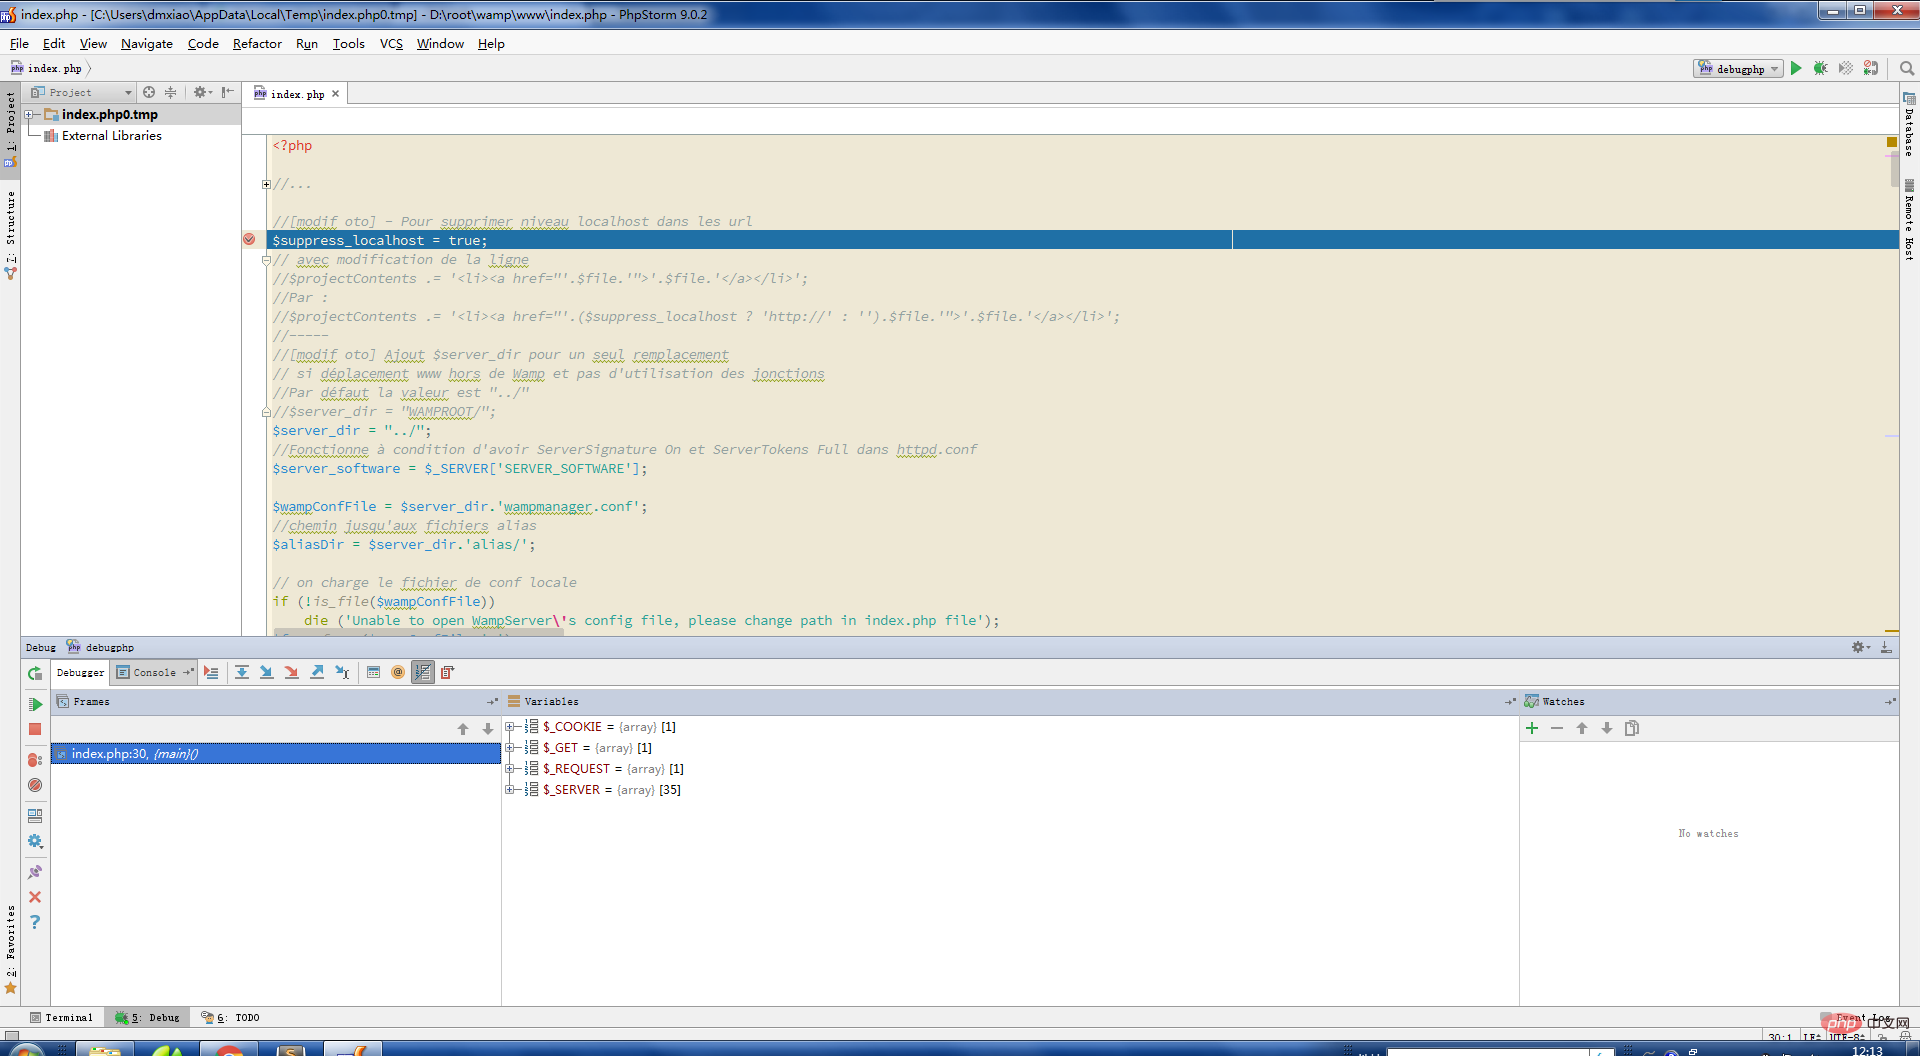 The above completes the debugging support for the browser.
The above is the detailed content of Detailed explanation of how to debug Phpstorm on the command line and in the browser. For more information, please follow other related articles on the PHP Chinese website!