
For those who are new to PHP, they may not know what xdebug is. Simply put, it is a PHP program error debugging tool. Then some novice friends may ask what is the use of xdebug? The xdebug tool can be used to analyze the running status of the tracking program. The xdebug tool can help PHP personnel develop programs more efficiently, conveniently and quickly. It is an essential tool for PHP developers.
phpstorm toolDownload address://m.sbmmt.com/xiazai/gongju/122
Then this article is We will introduce in detail the specific steps of phpstorm to configure xdebug tools and their use.
1. Set xdebug configuration items
1. Open the php.ini configuration file
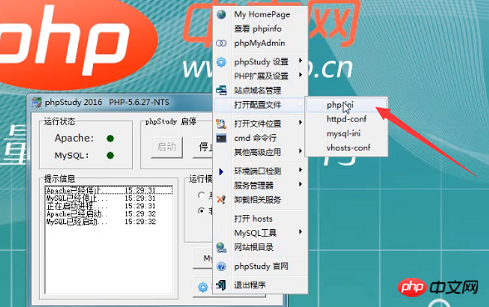
2. At the bottom of the php.ini file, find the code in the picture below and cancel the comment semicolon in front of this line of code.

3. Set some xdebug configuration items at the bottom of the php.ini file as follows:

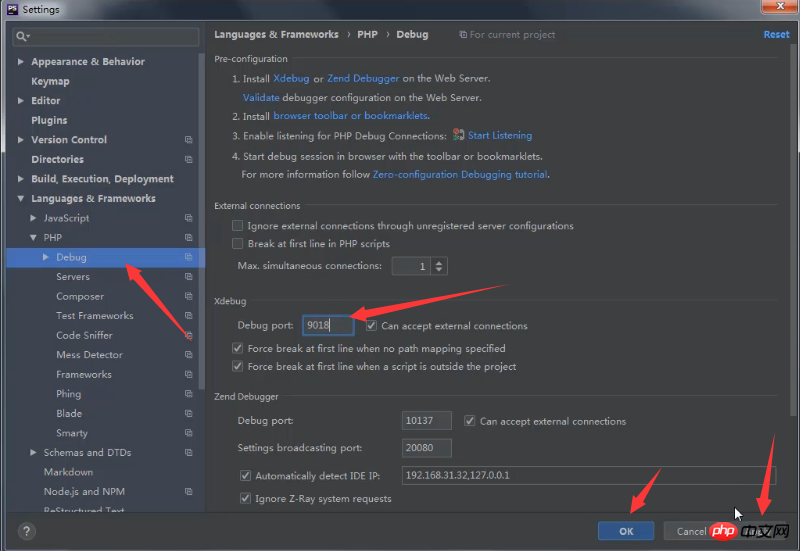
Remote port Number (here we set 9018);
Remote automatic startup item (1 means on by default, 0 means off);
Automatic tracking item (1 means on by default, 0 means off);
Remote host IP address (here we set 127.0.0.1, it can also be localhost);
Remote enable item (1 means remote enabled by default, 0 means closed).
4. Save the php.ini file and restart the Apache server.
2. phpstorm configure xdebug
1. Open phpstorm and find the settings under the file column.
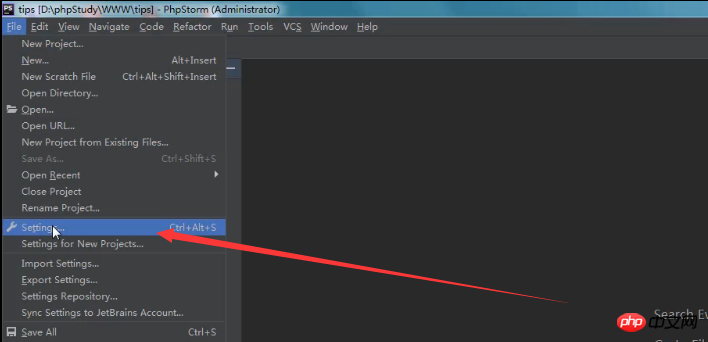
#2. In the settings, open the debug section to set the remote port number. The port number here must be the same as the port number set in your configuration file.
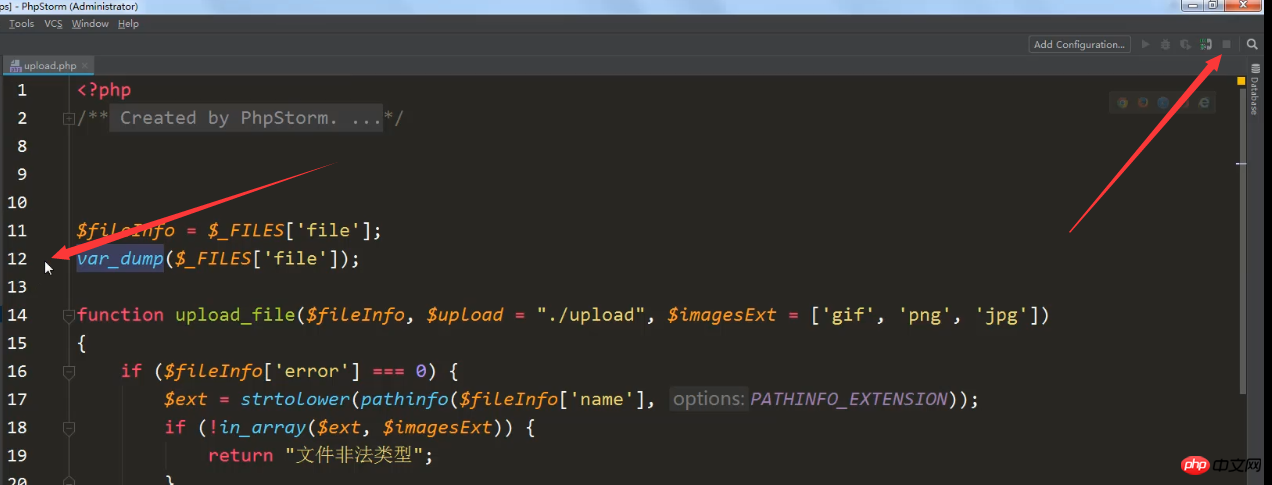
#3. Open the phpstorm editing interface, click on the small phone logo in the upper right corner, and turn on xdebug breakpoint debugging. Here we open a file for testing as shown below, put a breakpoint in the file, as shown on line 12, just click the mouse.

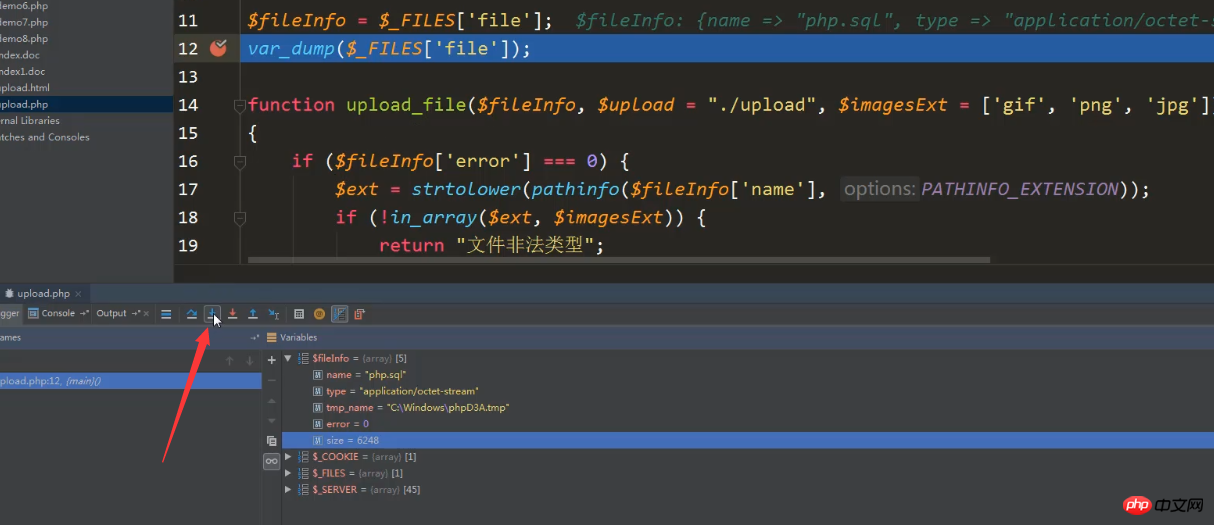
#4. Select a file to upload and then open phpstorm. The relevant content information of the breakpoint debugging point will be displayed at the bottom. 
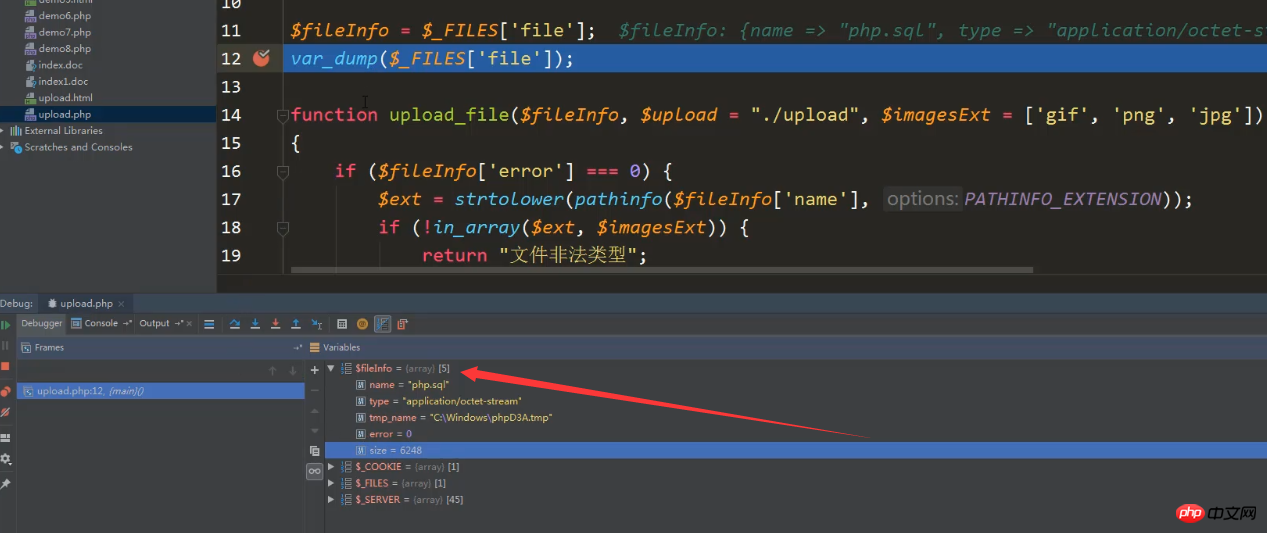
#5. If you want to continue viewing, you can choose to click the down arrow in the picture below.
#5. Click the small square sign in the upper right corner to turn off xdebug debugging.
The above is an introduction to the specific steps for configuring and using the phpstorm error debugging tool xdebug. This article has certain reference value. I hope it can be helpful to friends who need it!
If you want to know more about PHP, you can follow the PHP video tutorial on the PHP Chinese website. Everyone is welcome to refer to and learn!
The above is the detailed content of How to configure and use the xdebug tool in PHPStorm? (Picture + video tutorial). For more information, please follow other related articles on the PHP Chinese website!