

This time I will bring you a detailed explanation of the steps to dynamically implement a pie chart in html5 canvas. What are the precautions for dynamically implementing a pie chart in html5 canvas. Here are practical cases, let’s take a look.
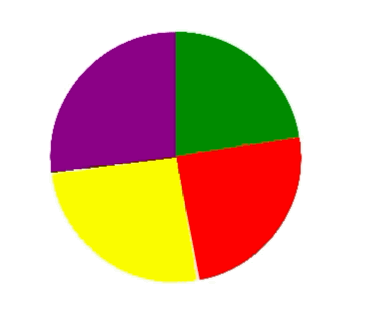
Let’s look at the renderings first
dom operation and the characteristics of canvas Written.
Canvas circle drawing is generally divided into solid circles and hollow circles. According to the demand analysis, we know that the circle is a solid circle. 1. First use canvas to draw a solid circle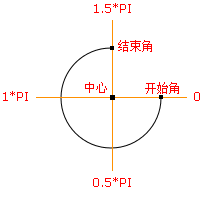
//伪代码
var canvas = document.createElement("canvas");
var ctx = canvas.getContext('2d');
ctx.beginPath();
ctx.arc(圆心x轴坐标,圆心y轴坐标,半径,开始角,结束角);
ctx.fillStyle = 'green';
ctx.closePath();
ctx.fill();//伪代码
var canvas = document.createElement("canvas");
var ctx = canvas.getContext('2d');
ctx.beginPath();
ctx.arc(圆心x轴坐标,圆心y轴坐标,半径,绿色开始角,绿色结束角);
ctx.fillStyle = 'green';
ctx.closePath();
ctx.fill();
ctx.beginPath();
ctx.arc(圆心x轴坐标,圆心y轴坐标,半径,红色开始角,红色结束角);
ctx.fillStyle = 'red';
ctx.closePath();
ctx.fill();
ctx.beginPath();
ctx.arc(圆心x轴坐标,圆心y轴坐标,半径,黄色开始角,黄色结束角);
ctx.fillStyle = 'yellow';
ctx.closePath();
ctx.fill();
ctx.beginPath();
ctx.arc(圆心x轴坐标,圆心y轴坐标,半径,紫色开始角,紫色结束角);
ctx.fillStyle = 'purple';
ctx.closePath();
ctx.fill();H5 WebWorkers multi-threaded development and usage detailed explanation
H5 offline application and client storage usage detailed explanation
The above is the detailed content of Detailed explanation of the steps to dynamically implement pie charts in html5+canvas. For more information, please follow other related articles on the PHP Chinese website!


![[Web front-end] Node.js quick start](https://img.php.cn/upload/course/000/000/067/662b5d34ba7c0227.png)


