

This time I will bring you a summary of JS debugging and debugging methods. What are the precautions for JS debugging? The following is a practical case, let’s take a look.
1. debugger;
I have said before that you can add a sentencedebugger; in the JavaScript code To manually create a breakpoint effect. Do you need conditional breakpoints? You just need to surround it with
if statements:
if (somethingHappens) {
  debugger;
}2. Set a breakpoint to trigger when the DOM node changes
Sometimes you will find that the DOM is not under your control, and something strange will happen to you. changes, making it difficult to find the source of the problem. There is a super easy-to-use function in the development tools of Google Chrome, which can specifically deal with this situation, called"Break on..." , you are in the DOM nodeRight-click to see this menu item.
The triggering condition of the breakpoint can be set when the node is deleted, there is any change in the node's attributes, or there is a change in one of its child nodes.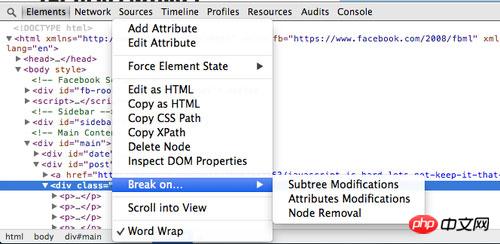
3. Ajax Breakpoints
XHR breakpoints, or Ajax breakpoints, as their names suggest, allow We set a breakpoint that triggers the specific Ajax calls when they occur. This trick is very effective when you are debugging network transmission of web applications.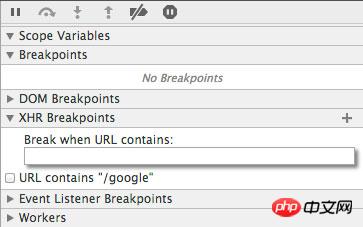
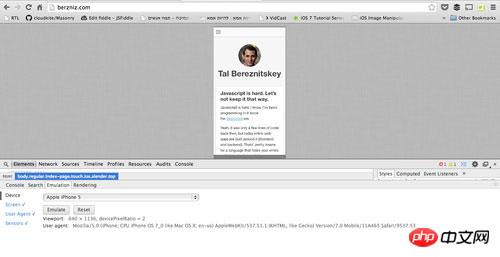
4. Mobile device simulation environment
There are some very interesting tools in Google Chrome to simulate mobile devices to help us Debug the running of the program on mobile devices. The way to find it is: press F12 to bring up the developer tools, and then press theESC key (the current tab cannot be Console), you will see the second layer debugging window appear. , there are various simulation devices available in the Emulationtab.
Audits.
It can quickly audit your website and give you very practical and effective suggestions and methods for optimizing your website.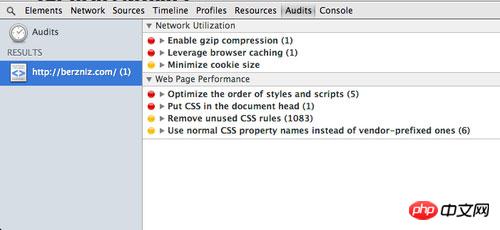
The above is the detailed content of Summary of JS debugging methods. For more information, please follow other related articles on the PHP Chinese website!


![[Web front-end] Node.js quick start](https://img.php.cn/upload/course/000/000/067/662b5d34ba7c0227.png)


