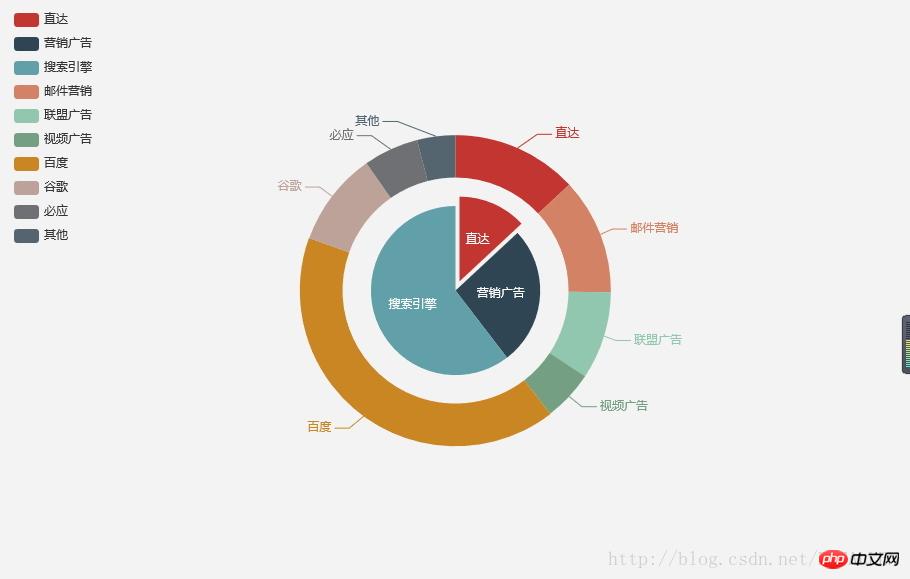
We often need to use some line charts, bar charts, pie charts, etc. in our projects. I have used heightCharts before, but later I felt that it was not open source and was a waste of time just for display, so I took a look at eCharts. So eCharts was added to the project built by vue-cli. Below are the specific steps and some of my own study notes. I hope it can help everyone.
The current front-end generally needs to complete the visualization of a large amount of data. Now is the era of big data and cloud computing, so data visualization is gradually becoming a trend. ECharts and d3.js are mature frameworks for visualization. It can be said that the charts produced satisfy your creativity.
Compared with the two, D3 is used by many other table plug-ins. It allows binding arbitrary data to the DOM and then applying data-driven transformations to the Document. You can use it to create basic HTML tables with an array, or take advantage of its fluid transitions and interactions to create stunning SVG bar charts with similar data.
The ECharts chart is more suitable for application, with a gorgeous appearance, but very practical.

The basic template of ECharts is very simple and easier to get started than d3.
Basic use of Echarts charts
1. Add webpack configuration to the vue-cli project, the latest version introduced in this article. Before version 3.1.1, the ECharts package on npm was unofficially maintained. Starting from 3.1.1, the official EFE package maintained the ECharts and zrender packages on npm.
Use npm to add the configuration in the package.json file and download the relevant npm package dependencies
npm install echarts --save
Then add
import echarts from "echarts"
var echarts = require('echarts');// 引入 ECharts 主模块
var echarts = require('echarts/lib/echarts');
// 引入柱状图
require('echarts/lib/chart/bar');
// 引入提示框和标题组件
require('echarts/lib/component/tooltip');
require('echarts/lib/component/title');<!-- ECharts图表测试 -->
<p id="charts" style="width:'100%',height:'3.54rem'">
<p id="main" :style="{width:'100%',height:'3.54rem'}"></p>
</p>export default {
name: 'Bank',
data () {
return {
}
},
components: {
},
computed: {
},
methods: {
},
mounted() {
/*ECharts图表*/
var myChart = echarts.init(document.getElementById('main'));
myChart.setOption({
series : [
{
name: '访问来源',
type: 'pie',
radius: '55%',
itemStyle: {
normal: {
// 阴影的大小
shadowBlur: 200,
// 阴影水平方向上的偏移
shadowOffsetX: 0,
// 阴影垂直方向上的偏移
shadowOffsetY: 0,
// 阴影颜色
shadowColor: 'rgba(0, 0, 0, 0.5)'
}
},
data:[
{value:400, name:'搜索引擎'},
{value:335, name:'直接访问'},
{value:310, name:'邮件营销'},
{value:274, name:'联盟广告'},
{value:235, name:'视频广告'}
]
}
]
})
}
}// 基于准备好的dom,初始化ECharts实例
var myChart = echarts.init(document.getElementById('main'));var option = {
xAxis: {
data: ["衬衫","羊毛衫","雪纺衫","裤子","高跟鞋","袜子"]
},
yAxis: {},
series: [{
name: '销量',
type: 'bar',
data: [5, 20, 36, 10, 10, 20]
}]
};myChart.setOption(option);
// 处理点击事件并且跳转到相应的百度搜索页面
myChart.on('click', function (params) {
window.open('https://www.baidu.com/s?wd=' + encodeURIComponent(params.name));
});{
// 当前点击的图形元素所属的组件名称,
// 其值如 'series'、'markLine'、'markPoint'、'timeLine' 等。
componentType: string,
// 系列类型。值可能为:'line'、'bar'、'pie' 等。当 componentType 为 'series' 时有意义。
seriesType: string,
// 系列在传入的 option.series 中的 index。当 componentType 为 'series' 时有意义。
seriesIndex: number,
// 系列名称。当 componentType 为 'series' 时有意义。
seriesName: string,
// 数据名,类目名
name: string,
// 数据在传入的 data 数组中的 index
dataIndex: number,
// 传入的原始数据项
data: Object,
// sankey、graph 等图表同时含有 nodeData 和 edgeData 两种 data,
// dataType 的值会是 'node' 或者 'edge',表示当前点击在 node 还是 edge 上。
// 其他大部分图表中只有一种 data,dataType 无意义。
dataType: string,
// 传入的数据值
value: number|Array
// 数据图形的颜色。当 componentType 为 'series' 时有意义。
color: string
}
myChart.on('click', function (params) {
 if (params.componentType === 'markPoint') {
  // 点击到了 markPoint 上
  if (params.seriesIndex === 5) {
   // 点击到了 index 为 5 的 series 的 markPoint 上。
  }
 }
 else if (params.componentType === 'series') {
  if (params.seriesType === 'graph') {
   if (params.dataType === 'edge') {
    // 点击到了 graph 的 edge(边)上。
   }
   else {
    // 点击到了 graph 的 node(节点)上。
   }
  }
 }

});myChart.on('click', function (parmas) {
$.get('detail?q=' + params.name, function (detail) {
myChart.setOption({
series: [{
name: 'pie',
// 通过饼图表现单个柱子中的数据分布
data: [detail.data]
}]
});
});
});What should I do if the Echarts chart is incomplete?
PHP Detailed explanation of using Echarts to generate data statistical reports
HTML5, JS, JQuery, ECharts asynchronous loading
The above is the detailed content of Detailed explanation of adding Echarts chart usage in vue. For more information, please follow other related articles on the PHP Chinese website!


