Home > Backend Development > Python Tutorial > Detailed explanation of Python debugging knowledge

Detailed explanation of Python debugging knowledge

小云云
Release: 2017-12-18 15:10:47
Original
2128 people have browsed it

After programming the program, use various means to conduct error checking and troubleshooting. The correctness of a program is not only reflected in the completion of normal functions, but more importantly, the correct handling of unexpected situations. From a psychological perspective, developers and debuggers should not be the same person. This article will share with you a detailed explanation of Python tuning knowledge, hoping to help you.

import pdb
age = int(input("请输入你家狗狗的年龄: "))
print("")#加入断点pdb.set_trace()if age < 0:
    print("你是在逗我吧!")elif age == 1:
    print("相当于 14 岁的人。")elif age == 2:
    print("相当于 22 岁的人。")elif age > 2:
    human = 22 + (age - 2) * 5
    print("对应人类年龄: ", human)
Copy after login
  1. Add breakpoint

    import pdb
    pdb.set_trace()
    Copy after login
    Copy after login
  2. Start running debugging
    Detailed explanation of Python debugging knowledge

    ##--> ; The arrow indicates the current statement;
    (Pdb) indicates waiting for debugging instructions.

  3. #hCommand (help) You can view all debugging instructions.
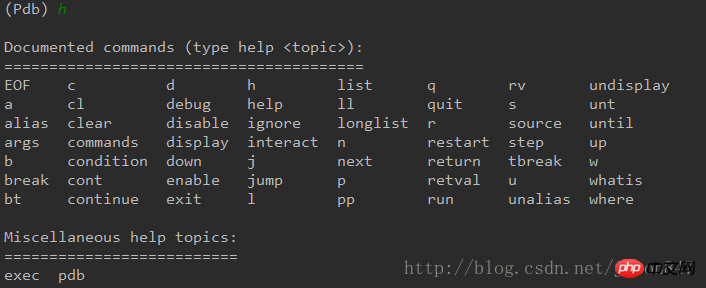
    Detailed explanation of Python debugging knowledge

  4. lInstructions (list) View the code context.

    Detailed explanation of Python debugging knowledge

  5. pCommand is used to view variables. Usage:
    p Variable name For example, view the value of the age variable

    Detailed explanation of Python debugging knowledge

  6. ##n

    Command (next) Single-step execution instructions.
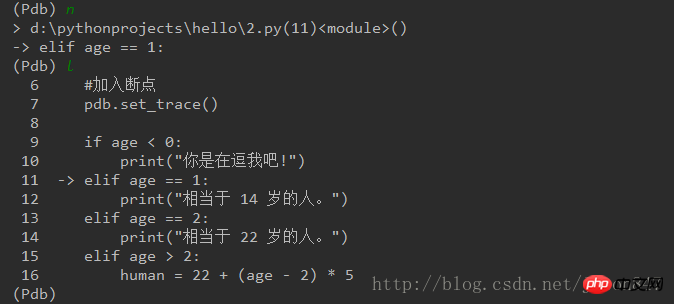
    Detailed explanation of Python debugging knowledge

  7. b

    Command (break) Add the specified breakpoint. Usage: b line number
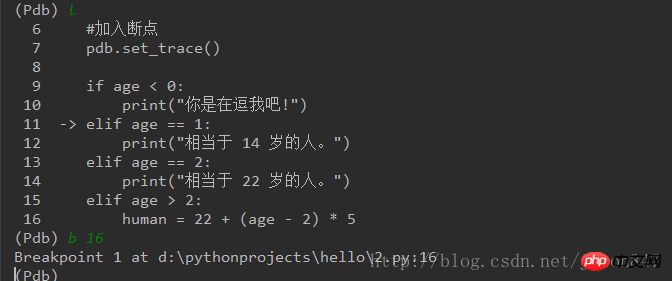
    Detailed explanation of Python debugging knowledge

  8. ##c
  9. Command (continue)

    Run to the breakpoint

    Detailed explanation of Python debugging knowledge

    Detailed explanation of Python debugging knowledge

  10. s
  11. Instruction (step)

    Enter the function After we modified the original code , add test function. This command can enter the function for debugging
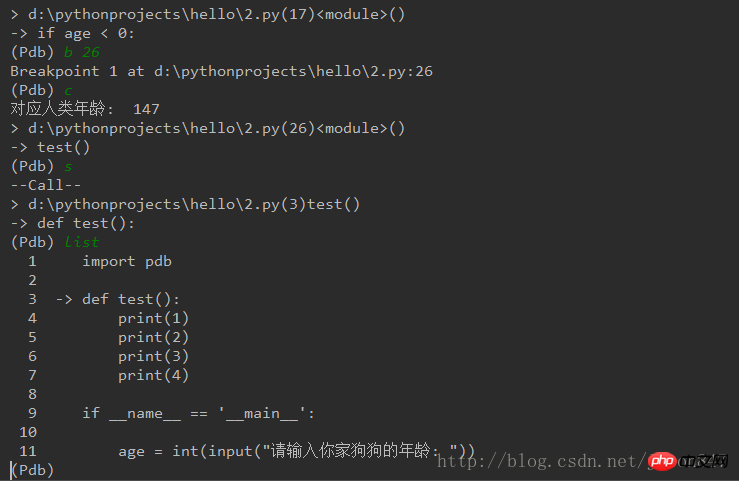

    Detailed explanation of Python debugging knowledge

  12. r
  13. Instruction (return)

    The execution code returns from the current function

    Summary

import pdb

age = int(input("请输入你家狗狗的年龄: "))
print("")#加入断点pdb.set_trace()if age < 0:
    print("你是在逗我吧!")elif age == 1:
    print("相当于 14 岁的人。")elif age == 2:
    print("相当于 22 岁的人。")elif age > 2:
    human = 22 + (age - 2) * 5
    print("对应人类年龄: ", human)
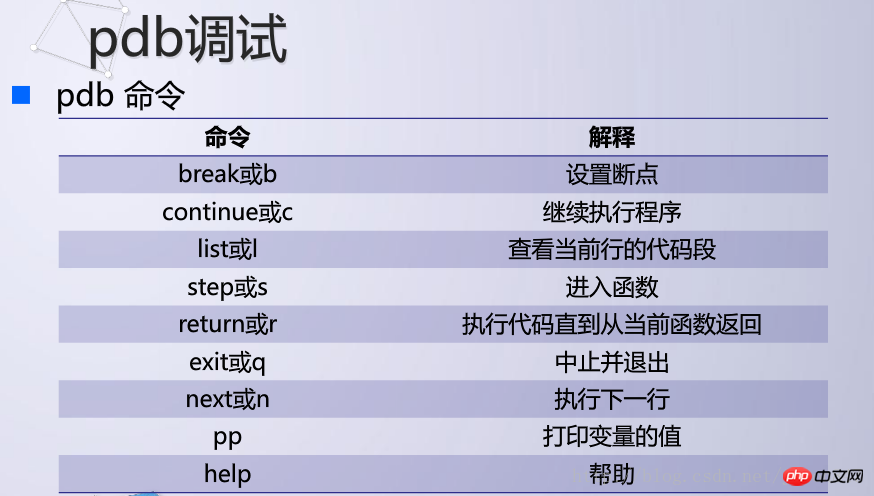
Copy after login

Detailed explanation of Python debugging knowledge

Add breakpoint
    import pdb
    pdb.set_trace()
    Copy after login
    Copy after login
  1. Start running debugging

  2. Detailed explanation of Python debugging knowledge-->

    The arrow indicates the current statement;

    (Pdb) indicates waiting for debugging instructions.

  3. #h
  4. Command (help)

    You can view all debugging instructions.

    Detailed explanation of Python debugging knowledge

  5. l
  6. Instructions (list)

    View the code context.

    Detailed explanation of Python debugging knowledge

  7. p
  8. Command

    is used to view variables. Usage: p Variable name
    For example, view the value of the age variable

    Detailed explanation of Python debugging knowledge

    ##n
  9. Command (next)
  10. Single-step execution instructions.


    Detailed explanation of Python debugging knowledge

    b
  11. Command (break)
  12. Add the specified breakpoint. Usage:

    b line number

    Detailed explanation of Python debugging knowledge##c

    Command (continue)
  13. Run to the breakpoint


  14. Detailed explanation of Python debugging knowledge

    Detailed explanation of Python debugging knowledges

    Instruction (step)
  15. Enter the function
  16. After we modified the original code , add test function. This command can enter the function for debugging

  17. rInstruction (return)
    Execution code returns from the current function

  18. Summary

    Detailed explanation of Python debugging knowledge

    Related recommendations:

    PHP prints the calling function entry address (stack) to facilitate debugging

    Node.js learning summary debugging Code method_node.js

    PHP prints the calling function entry address (stack) to facilitate debugging

    The above is the detailed content of Detailed explanation of Python debugging knowledge. For more information, please follow other related articles on the PHP Chinese website!

Related labels:
source:php.cn
Statement of this Website
The content of this article is voluntarily contributed by netizens, and the copyright belongs to the original author. This site does not assume corresponding legal responsibility. If you find any content suspected of plagiarism or infringement, please contact admin@php.cn
Popular Tutorials
More>
Latest Downloads
More>
Web Effects
Website Source Code
Website Materials
Front End Template