This article mainly introduces the application examples of Chart.js in Laravel projects. The editor thinks it is quite good, so I will share it with you now and give it as a reference. Let’s follow the editor and take a look.
Introduction
Chart.js is an HTML5 chart library that uses the canvas element to display a variety of client charts. Supports line charts, column charts, radar charts, pie charts, donut charts, etc. This article will introduce how to use chart.js in laravel projects
Installation
You can Install chart.js in npm or bower via the following command.
npm install chart.js --save
bower install chart.js --save
You can use CDN link in your project.
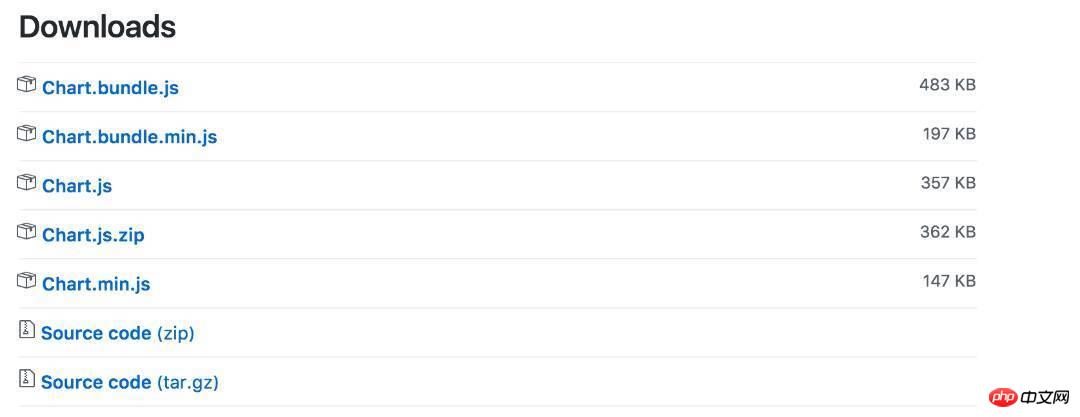
https://cdnjs.cloudflare.com/ajax/libs/Chart.js/2.6.0/Chart.bundle.js
https://cdnjs.cloudflare.com/ajax/libs/Chart.js/2.6.0/Chart.bundle.min.js
https://cdnjs.cloudflare.com/ajax/libs/Chart.js/2.6.0/Chart.js
https://cdnjs.cloudflare.com/ajax/libs/Chart.js/2.6.0/Chart.min.js
You can download the latest version of Chart.js from GitHub. If you download it from github, there are many examples to learn from.

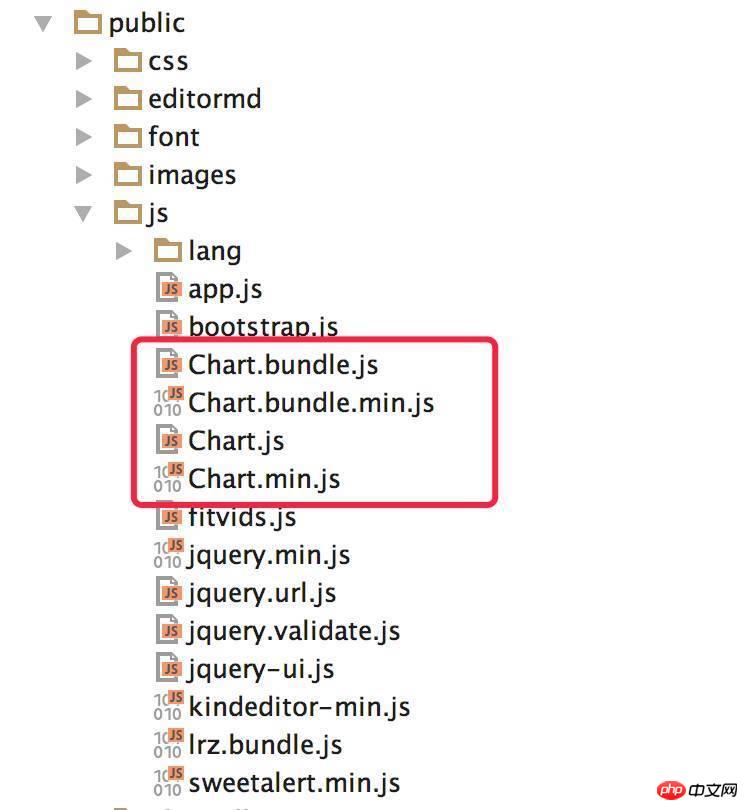
What I chose here is to download several js files and then place them under the public/js directory of the Laravel project, as shown below:

Use
to add the following code wherever you want in the html. This canvas is the location of the chart. :
<canvas id="my_chart" width="300" height="300"></canvas>
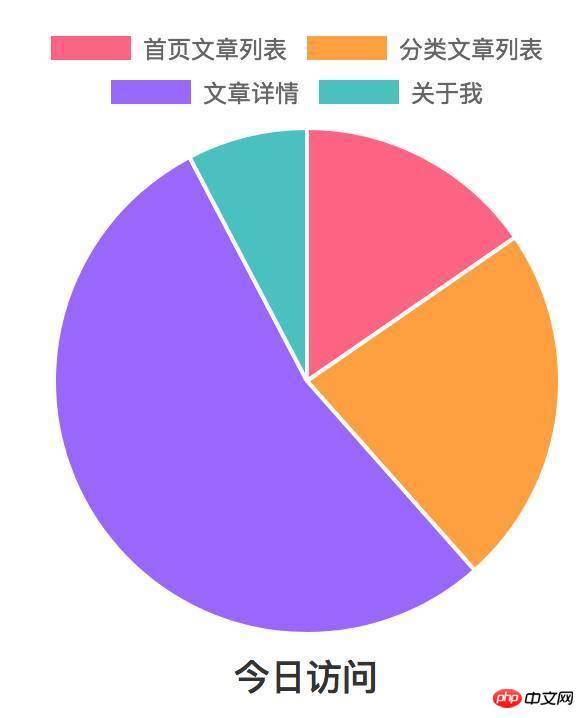
Then implement a data query method in the controller and return a json string. The specific data depends on your needs. Here I just After checking a set of data, make a pie chart. You can also use multiple sets of data to make line charts, bar charts, etc.
  public function GetChartData(){
    $my_data = array();
    array_push($today_data, VisitCapacity::where('my_data','>=', Carbon::today())->where('site',1)->count());
    array_push($today_data, VisitCapacity::where('my_data','>=', Carbon::today())->where('site',2)->count());
    array_push($today_data, VisitCapacity::where('my_data','>=', Carbon::today())->where('site',3)->count());
    array_push($today_data, VisitCapacity::where('my_data','>=', Carbon::today())->where('site',4)->count());
    Log::info(json_encode($my_data));
    return $my_data;
}Add routing:
Route::get('get_chart_data', 'Member\UserController@GetChartData');
js implementation:
$.get('get_chart_data',function (data, status) {
var ctx = document.getElementById("my_chart").getContext("2d");
      var my_chart = new Chart(ctx,{
        type: 'pie',
        data: {
          labels: [
            "首页文章列表",
            "分类文章列表",
            "文章详情",
            "关于我",
          ],
          datasets: [{
            data: data,
            backgroundColor: [
              window.chartColors.red,
              window.chartColors.orange,
              window.chartColors.purple,
              window.chartColors.green,
            ],
          }]
        },
        options: {
          responsive: true,
        }
      });
});Definition of color:
window.chartColors = {
  red: 'rgb(255, 99, 132)',
  orange: 'rgb(255, 159, 64)',
  yellow: 'rgb(255, 205, 86)',
  green: 'rgb(75, 192, 192)',
  blue: 'rgb(54, 162, 235)',
  purple: 'rgb(153, 102, 255)',
  grey: 'rgb(201, 203, 207)'
};The result is as shown below:

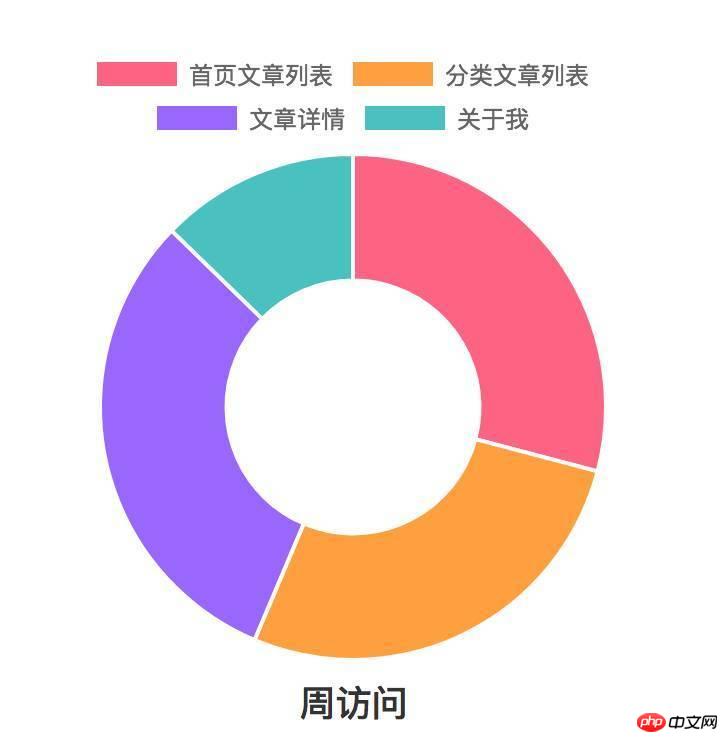
Change the value of type in js Change pie to dough, and the result is as follows:

The above is the detailed content of Detailed explanation on the use of Chart.js in Laravel project. For more information, please follow other related articles on the PHP Chinese website!


