1. nethogs
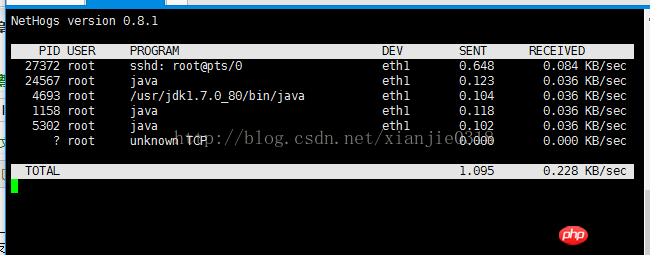
1) NetHogs is an open source, free, network traffic monitoring tool under the terminal. It can monitor the process or process of Linux Application network traffic. NetHogs can only monitor the network bandwidth usage of the process in real time. NetHogs supports IPv4 and IPv6 protocols, local network cards and PPP links
2) Install under debian
apt- get install nethogs
Install under centos
yum install nethogs
3) Use the command nethogs to view traffic data in real time

View the function nodes corresponding to each process to monitor the amount of network traffic data consumption
4)NetHogs provides interactive control instructions:
m : Cycle between display modes (kb/s, kb, b, mb) Switch the network speed display unit
r : Sort by received. Sort by received traffic
s: Sort by sent. Sort by sent traffic
q: Quit and return to the shell prompt. Exit the NetHogs command tool
2, nload
can monitor in real time The traffic of the network card is divided into two parts: input traffic Incoming and output traffic Outgoing. At the same time, the current, average, minimum, maximum, and total traffic values are counted, and displayed in a dynamic graphic format so that you can see them clearly at a glance
Install apt-get install nload yum install nload
nload

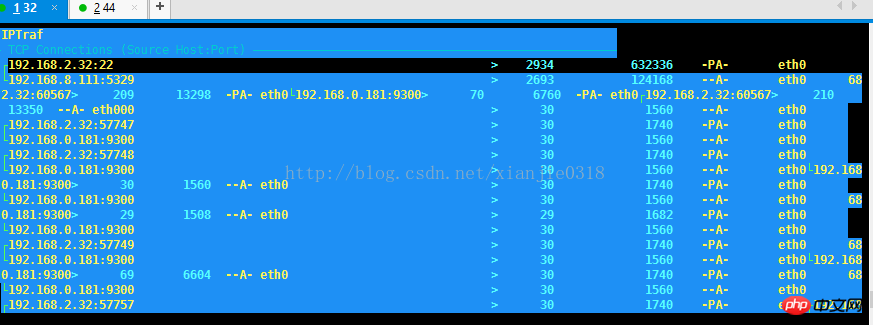
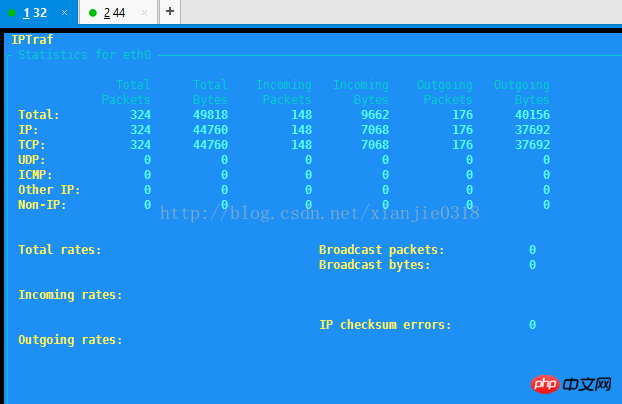
1) iptraf is an IP LAN monitor based on ncurses, used to generate Including TCP information, UDP count, ICMP and OSPF information, Ethernet load information, node status information, IP checksum errors and other statistical data.
Its ncurses-based user interface saves users from remembering tedious command line switches.
IP traffic monitor, used to display IP traffic change information in your network. Includes TCP identification information, packet and byte counts, ICMP details, and OSPF packet types.
Simple and detailed Interface statistics, including IP, TCP, UDP, ICMP, non-IP and other IP packet counts, IP checksum errors , interface activity, packet size counts.
TCP and UDP service monitor, able to display the number of packets sent and received on common TCP and UDP application ports.
The LAN data statistics module can discover online hosts and display statistical information on data activities on them.
Display of TCP, UDP, and other protocols Filters, allowing you to view only the traffic of interest.
Log function.
Supports Ethernet, FDDI, ISDN, SLIP, PPP and local loopback interface types.
Utilizes the raw socket interface built into the Linux kernel, allowing it (referring to iptraf) to be used on various supported network cards
Full screen, menu driven operation.
Real-time viewing via
Navigationmenu
IP traffic monitorGeneral Interface Statistics of the network interface
Details of the network interface Detailed Interface Statistics
Statistical
BreakdownsLAN Station Statistics
Filters...
Configuration( Configure...)
Exit


The above is the detailed content of Graphic tutorials on the use of several network traffic monitoring tools under Linux. For more information, please follow other related articles on the PHP Chinese website!


