Home > Web Front-end > JS Tutorial > Detailed introduction to JavaScript visual chart library MetricsGraphics.js

Detailed introduction to JavaScript visual chart library MetricsGraphics.js

黄舟
Release: 2017-03-15 17:32:24
Original
2228 people have browsed it

JavaScriptDetailed introduction to the visual chart library MetricsGraphics.js

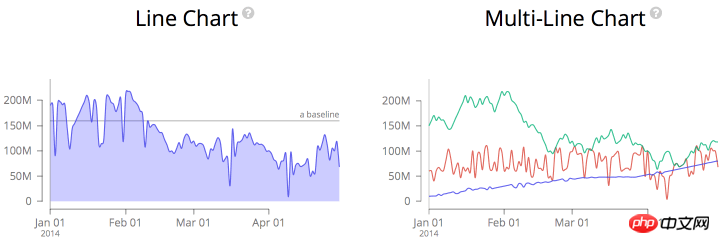
MetricsGraphics.js is also a responsive chart library based on JavaScript , similar to Chartist.js, MetricsGraphics.js also supports almost all types of charts, including line charts, column charts, pie charts, etc. At the same time, MetricsGraphics.js is based on the visual chart library D3, so developers can customize many powerful chart functions.

How to use MetricsGraphics.js

Let’s take a look at the renderings first:
##JavaScript Code:

MG.data_graphic({
    title: "Downloads",
    description: "This graphic shows a time-series of downloads.",
    data: [{'date':new Date('2014-11-01'),'value':12},
           {'date':new Date('2014-11-02'),'value':18}],
    width: 600,
    height: 250,
    target: '#downloads',
    x_accessor: 'date',
    y_accessor: 'value',
})
Copy after login

The overall effect of MetricsGraphics.js is pretty good, but some resources need to be bypassed before they can be used normally, but you can also download the source code to try it out.

The above is the detailed content of Detailed introduction to JavaScript visual chart library MetricsGraphics.js. For more information, please follow other related articles on the PHP Chinese website!

source:php.cn
Statement of this Website
The content of this article is voluntarily contributed by netizens, and the copyright belongs to the original author. This site does not assume corresponding legal responsibility. If you find any content suspected of plagiarism or infringement, please contact admin@php.cn
Popular Tutorials
More>
Latest Downloads
More>
Web Effects
Website Source Code
Website Materials
Front End Template