one. Preface
We can use it when we want to analyze the performance of a certain SQL.
Profiling is only open since mysql5.0.3 version.
After starting the profile, all queries including incorrect statements will be recorded.
Close the session or set profiling=0 to close it. (If the profiling_history_size parameter is set to 0, it also has the profiling effect of turning off MySQL.)
This tool can be used to query the SQL execution status, how long System lock and Table lock take, etc.,
It is very important to locate the I/O consumption and CPU consumption of a statement. (SQL The two largest resources consumed by statement execution are IO and CPU)
--After mysql5.7, profile information will be gradually abandoned. MySQL recommends using performance schema
two. Process
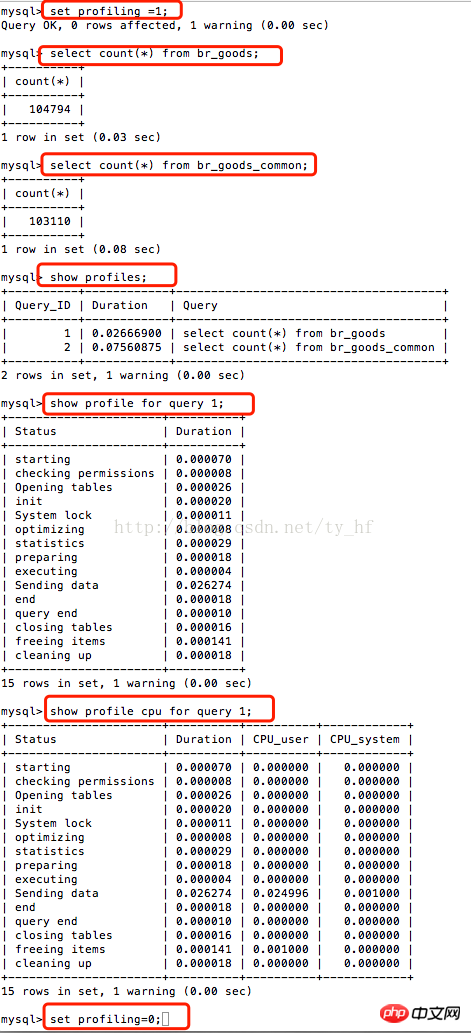
The simple process is as follows:
##
set profiling=1;  				//打开分析

run your sql1;

run your sql2;

show profiles;					//查看sql1,sql2的语句分析

show profile for query 1;		//查看sql1的具体分析

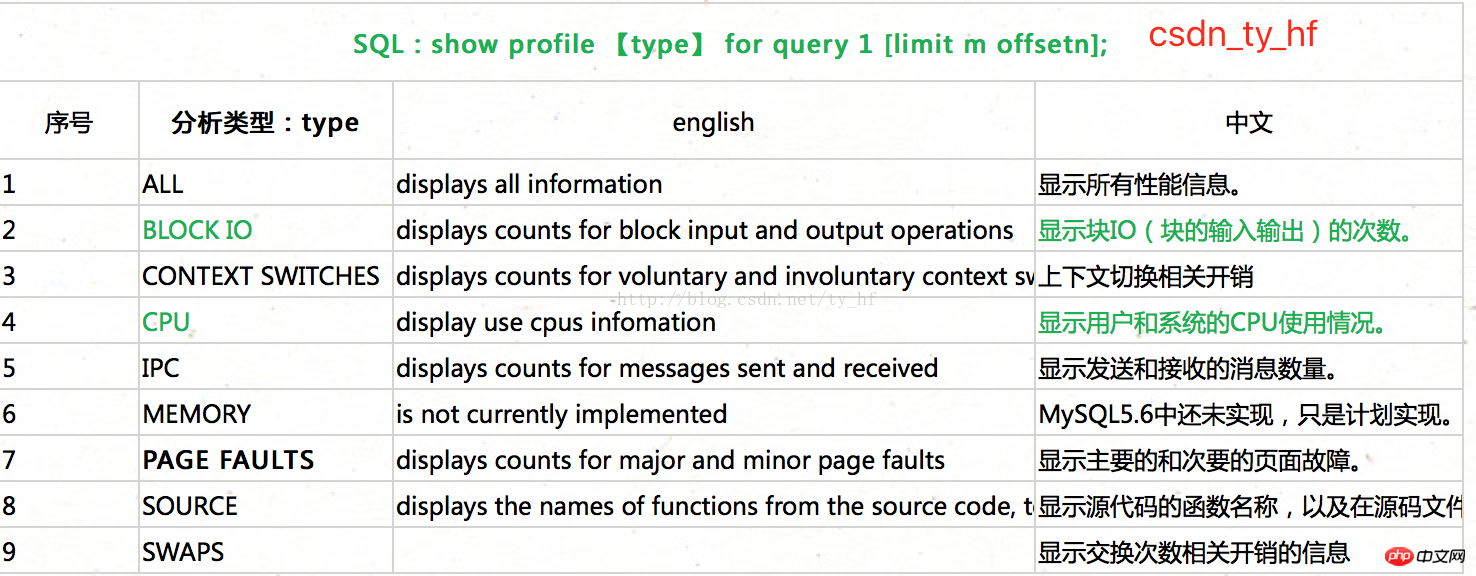
show profile ALL for query 1;	//查看sql1相关的所有分析【主要看i/o与cpu,下边分析中有各项意义介绍】

set profiling=0;  				//关闭分析


#three. Meaning analysis


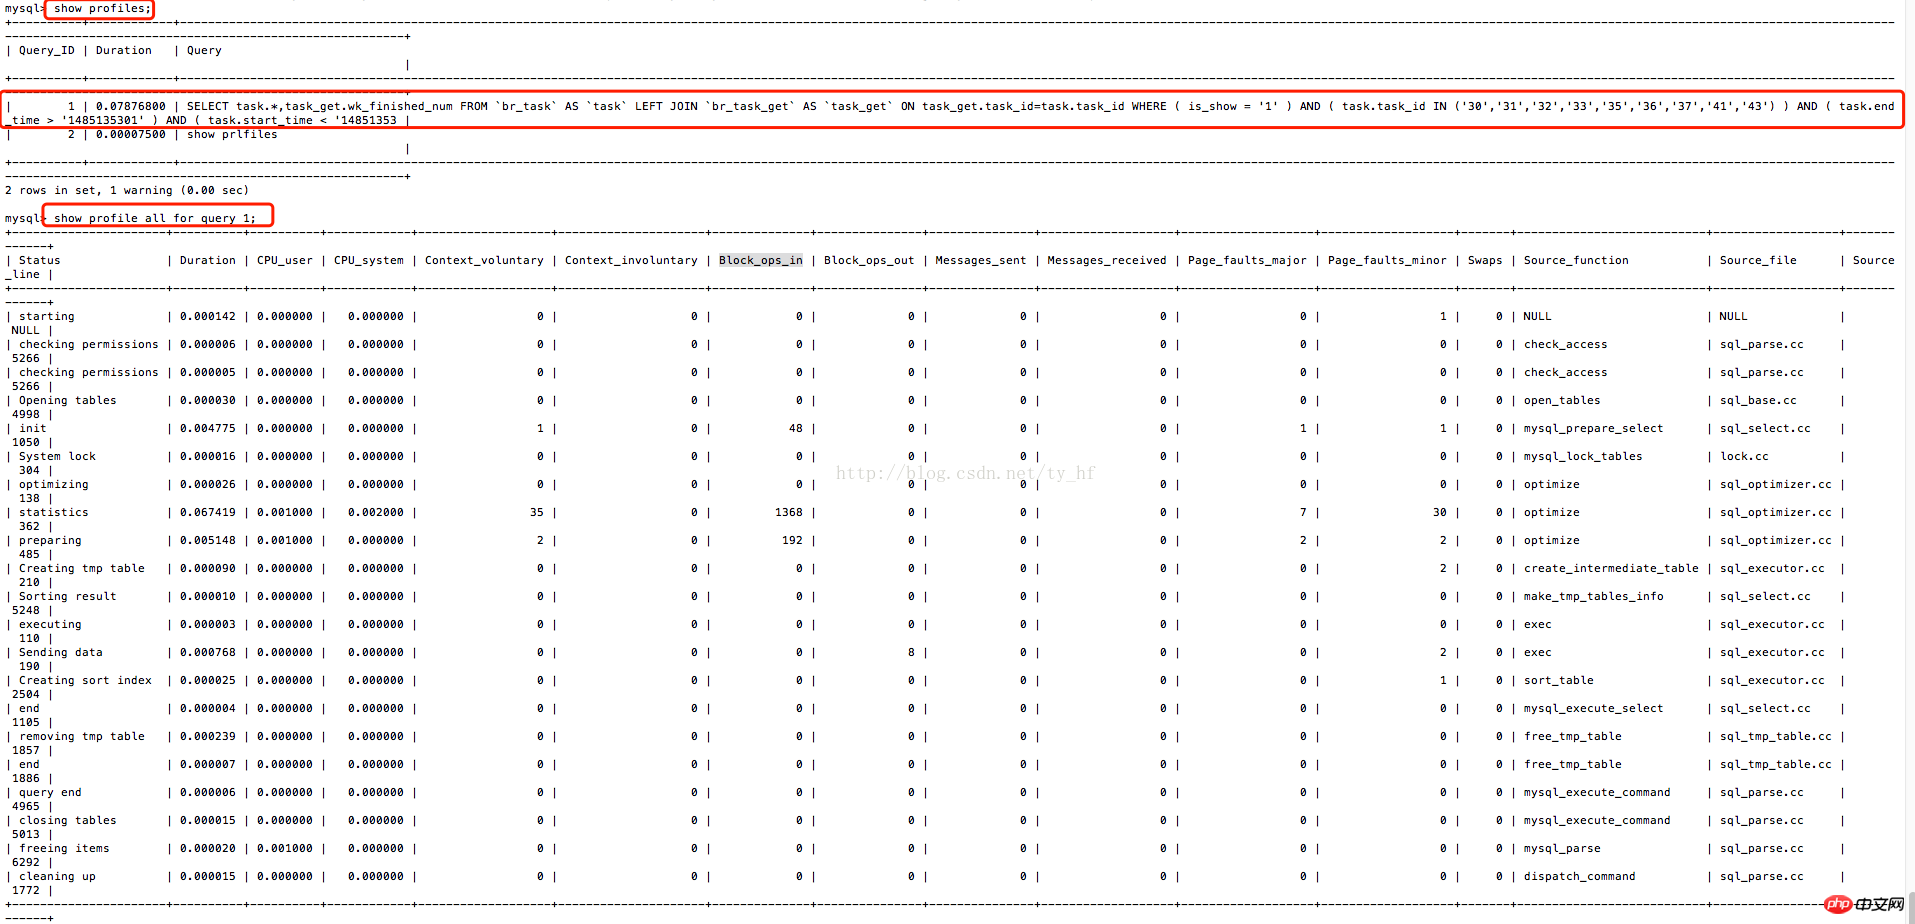
##The meaning of the horizontal bar in the above picture
"Status": "query end", status
"Duration": "1.751142", duration
"CPU_user": "0.008999", cpu user
"CPU_system": "0.003999", cpu system
"Context_voluntary": "98", context active switching
"Context_involuntary": "0", context passive switching
"Block_ops_in": "8", blocked input operations
"Block_ops_out": "32", blocked output operations
"Messages_sent": "0 ", Messages sent
"Messages_received": "0", Messages received
"Page_faults_major": "0", Main paging errors
"Page_faults_minor": "0", page faults
"Swaps": "0", number of swaps
"Source_function": "mysql_execute_command", source function
"Source_file": "sql_parse.cc", source file
"Source_line": "4465" Source code line
+------------------- ---+----------+----------+----------------+
The meaning of the vertical column in the above picture
+----------------------+------- ---+----------+----------------+
starting:Start
checking permissions:Checking permissions
Opening tables:Opening tables
init:Initialization
System lock: System lock
optimizing: Optimizing
##statistics: Statistics
##preparing: prepareexecuting: execute
Sending data: Sending data
##Sorting result: Sortingend :结束 query end :查询 结束 closing tables : 关闭表 /去除TMP 表 freeing items : 释放物品 cleaning up :清理 +----------------------+----------+----------+------------+ 一般情况下,常用以下语句也就够了 :mysql->SHOW profile CPU,BLOCK IO io FOR query 2;
以上就是Mysql分析-profile详解的内容,更多相关内容请关注PHP中文网(m.sbmmt.com)!


