
Function Overview
Mini program data analysis is a data analysis tool for mini program developers and operators, providing key indicator statistics, real-time access monitoring, custom analysis, etc. Help iterative optimization and operation of mini program products. The main functions are as follows: Overview: Provides mini program key indicator trends and top page access data to quickly understand the mini program development overview; Access analysis: Provides mini program user access source, scale, frequency, duration, depth, page details and other data, and provides detailed analysis New and active users; real-time statistics: provide real-time access data to the mini program to meet real-time monitoring needs; custom analysis: configure custom reporting to finely track user behavior within the mini program, combining user attributes, system attributes, and event attributes Conduct flexible and multi-dimensional event analysis and funnel analysis to meet the personalized analysis needs of mini programs; retention analysis: provide retention data of new users and active users of mini programs, analyze user retention and loss, the function is under development; user portrait: provided The user portrait data of the mini program includes user region, gender, platform type, device, network type, etc. The function is under development.
Overview
Yesterday Overview

View yesterday’s key user indicators, reflect the mini program’s user activity profile yesterday, and compare it to the day before and the week The growth rate before and one month ago.
Trend Overview
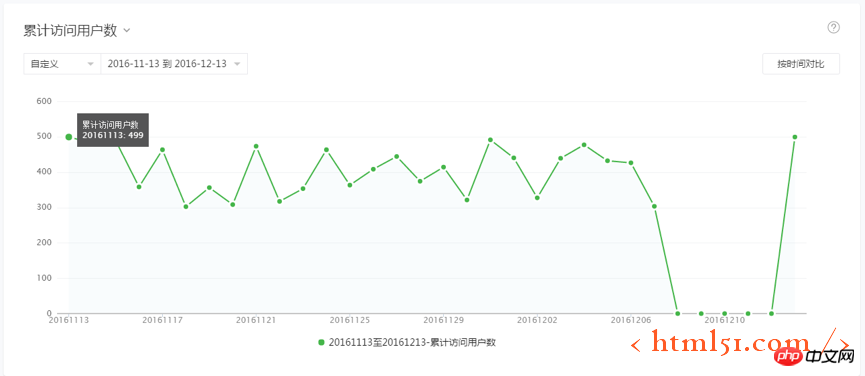
View the trend of key indicators, including the cumulative number of visitors, the number of opens, the number of visits, the number of visitors, the number of new visitors, the number of shares, and the number of shares Number of people, average length of stay per person, average length of stay per time (see [Indicator Explanation]), you can select a time for comparison.
Top page
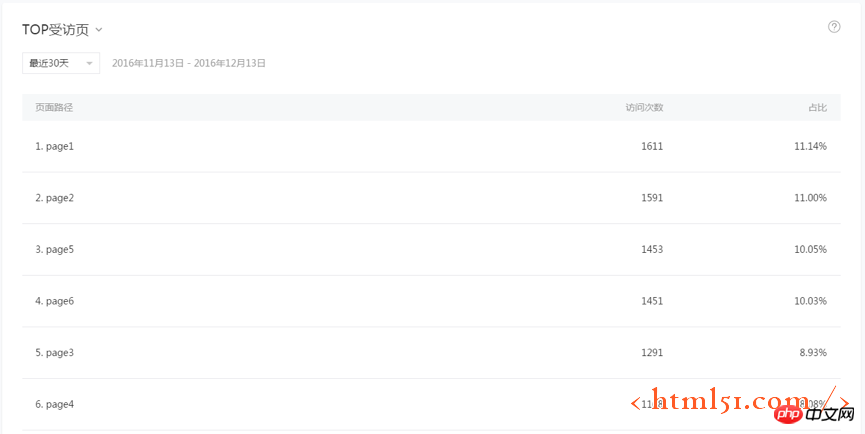
View the pages most visited by users, as well as the number of page visits and their proportion (number of visits to a single page/total visits), distinguish between entry pages and Interviewed page. Among them, the entry page refers to the first page that the user visits when entering the mini program; the visited page refers to every page that the user visits.
Real-time statistics
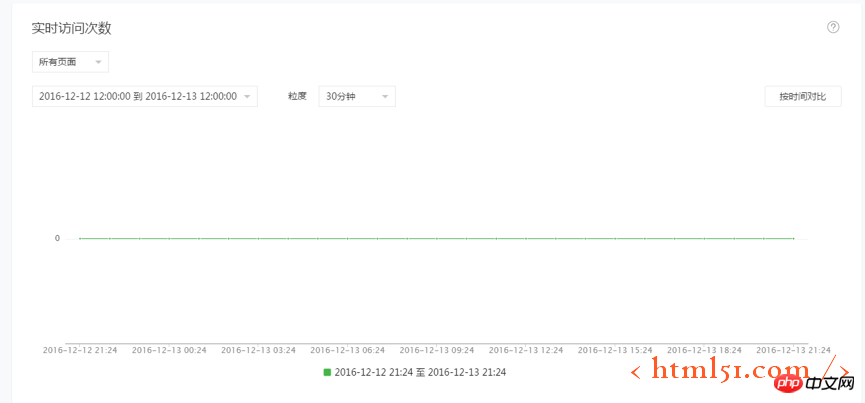
View real-time user access data, you can select all pages or a single page for analysis For objects, you can select specific time granularity (1 minute, 5 minutes, 10 minutes, 30 minutes, 1 hour), and compare by time. In order to better view data trends, when the time granularity is minutes, please pay attention to selecting the time range appropriately.
Detailed data view the total number of visits and proportion of each page within the selected time range.
Access Analysis
Access Trend
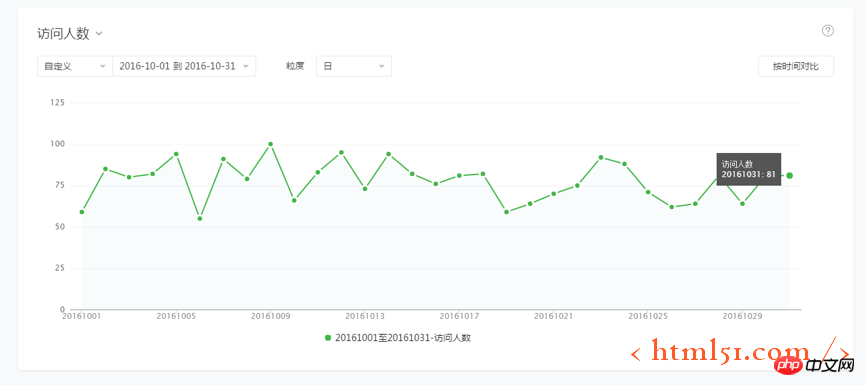
View the user access trend of the mini program, including the number of opens, the number of visits, the number of visitors, the number of new users, Average visit duration per person, average visit duration per visit, and average visit depth. (See [Indicator Explanation])
You can select the time granularity and view it in summary by day, week, or month. When the time granularity is weekly or monthly, the number of times is the cumulative summary value, and the number of people is deduplicated.
Access distribution
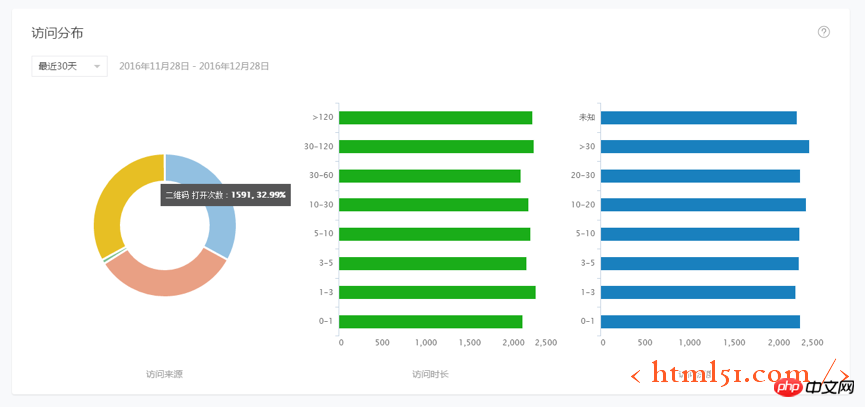
Access source, that is, the specific scenario where users access the mini program, such as QR code, mini program desktop, etc. You can check the number of times the mini program is opened in each scenario and analyze the user channels of the mini program.
Access duration, that is, the length of time a user stays from opening the mini program to actively closing or timeout exiting the mini program. You can view the number of openings in each duration interval and analyze the user's love or dependence on the mini program.
Access depth, that is, the number of deduplicated pages accessed by users from opening the mini program to actively closing or timeout exiting the mini program. You can view the number of openings in each access depth range to understand the average users and depth of the mini program. User distribution.
Visit page
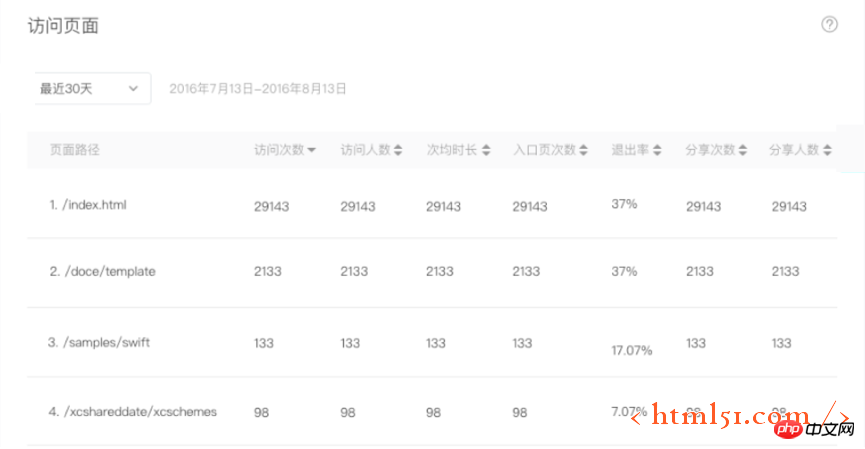
Check the number of visits, number of visitors, average usage time, number of entrance pages, number of exit pages, exit rate, number of shares, and number of people sharing each mini program page within the selected time range. (See [Indicator Explanation])
The above indicators are cumulative values within the time range. Display can be sorted by individual indicators.
Customized Analysis
Customized analysis supports flexible multi-dimensional and near-real-time user behavior analysis. Through customized reporting, users’ behavior within the mini program can be tracked in a refined manner to meet standards such as page visits. Personalized analysis needs beyond statistics. For example, by configuring custom reporting and collecting data, e-commerce mini-programs can complete the following analysis:
What is the distribution of people who purchase goods by province, city, age, and gender? What are the differences in the quantity and price of goods purchased by different user groups?
What is the gradual conversion rate when a user visits the product page, views product details, reads comments, places an order, pays, and completes the purchase? Are there differences in conversions among different user groups?
How active are the users who participated in online activities today at various time periods (hourly level)?
Quick Start
Use the mini program to customize analysis. It is recommended to follow the following steps
Clear data requirements
According to product characteristics, reasonably define events, configure and report
Test and publish event configuration, collect data
Combine with specific needs, analyze the data
Clear requirements
For example, an e-commerce applet may need to analyze:
The volume of product orders and total payment amount in different regions;
The conversion and loss of each step in the product purchase process.
Define events
Data is stored and analyzed based on events as a model. In e-commerce mini programs, the user purchasing process may include the following events:
View product
View details
Join Shopping cart
Place an order
Pay
Log in and enter "Data Analysis" - "Customized Analysis" - "Event Management" , click "New Event".

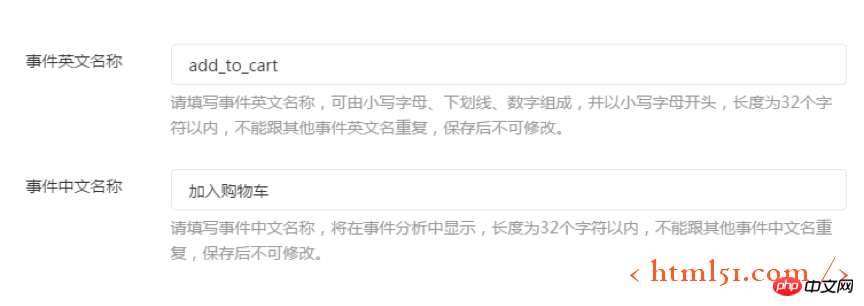
Take the add to shopping cart event as an example, fill in the English and Chinese names of the event:
Fill in the event configuration and definition How to collect data:
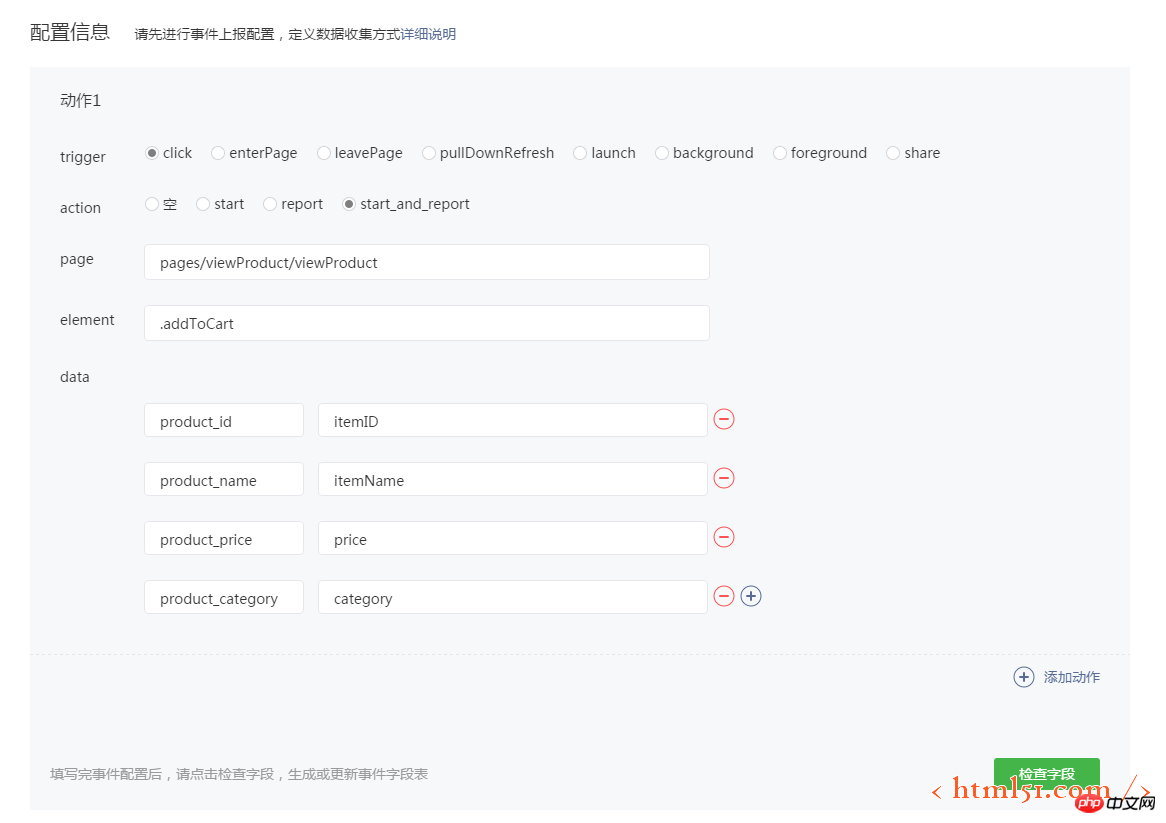
#In this example, an action is used to report the "Add to Cart" event.
trigger, trigger condition, click, indicates that the click operation is triggered;
action, the action when triggered, start_and_report, indicates that data is collected in each click And report it;
page, to trigger the page, fill in viewProduct (viewProduct is the product details page);
element, to trigger the element, fill in .addToCart (.addToCart is a " "Add to cart" button);
data, the event data and its source are represented by "field name and field value", where the field value is a variable on the page. .
In this example, data has four items:
product_id : itemID
product_name : itemName
product_price : price
product_category : category
That is: the product_id field of the
event, Collect the itemID variable on the viewProduct page;
The product_name field of the event collects the itemName variable on the viewProduct page;
The product_price field of the event collects the price variable on the viewProduct page;
The product_category field of the event collects the viewProduct category variable on the page;
The above content means: when the user clicks the .addToCart button on the viewProduct page, a record is reported to the add_to_cart event, and the product_id, product_name, product_price, product_category fields of the event are taken. The values are itemID, itemName, price, and category on the page.
After confirming the configuration, click "Check Fields".
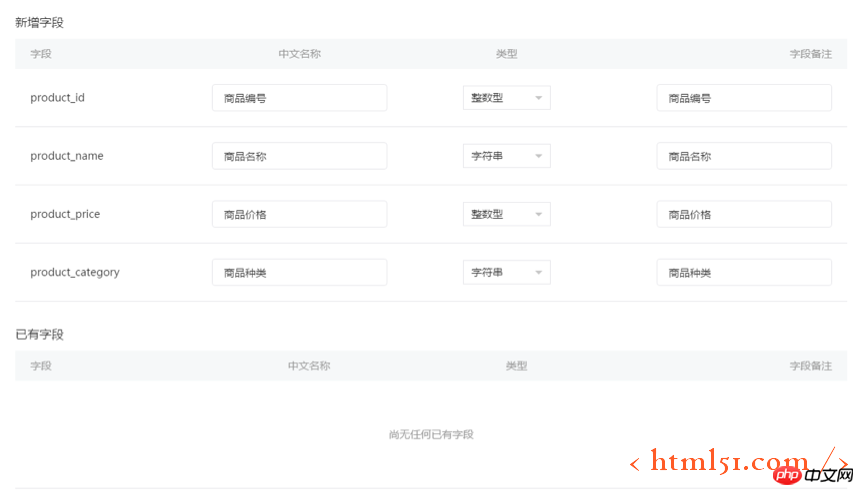
At this time, you will be prompted for the specific fields included in the add_to_cart event, and continue to add the name, data type and remark information of the fields.
Testing and Publishing
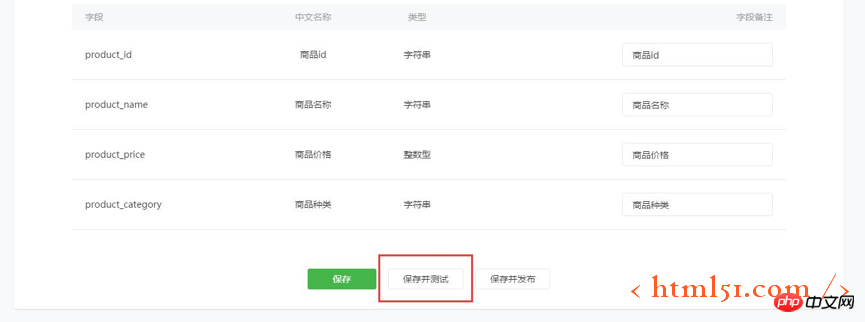
After confirming the field information, click "Save and Test" to save the current configuration and test whether the reported data meets expectations.
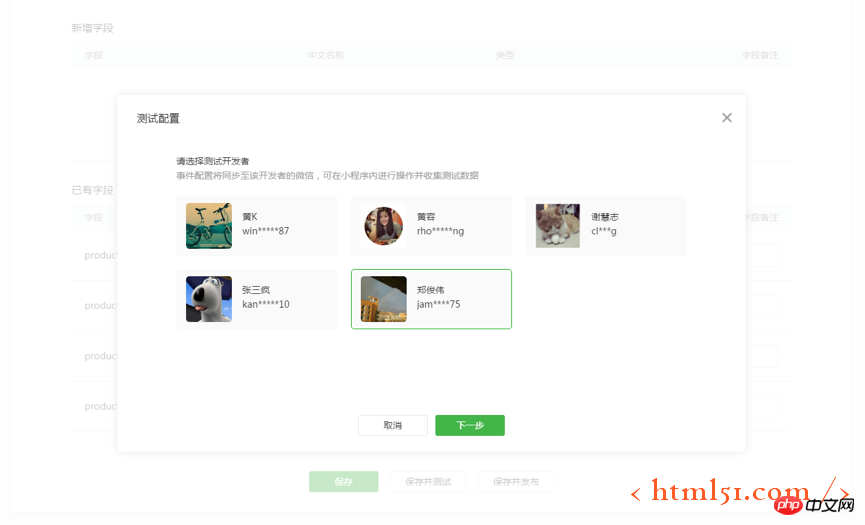
Select a developer, click "Next", and the event configuration will be synchronized to the selected developer's device in real time.
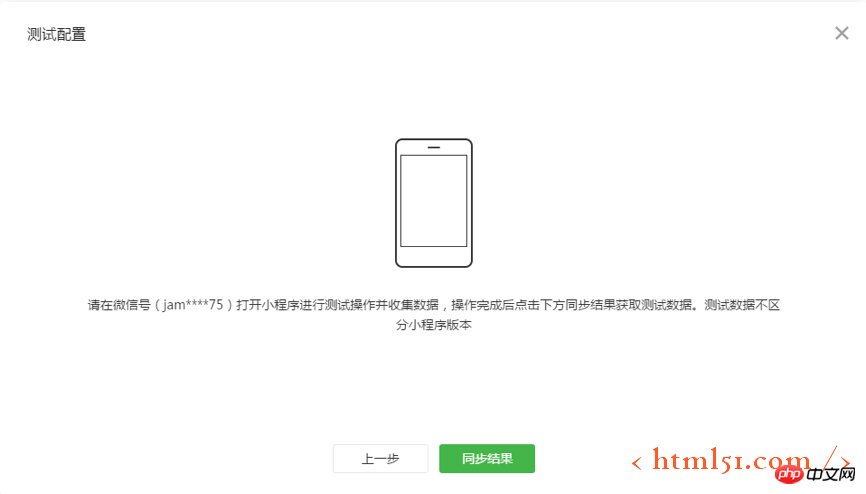
After the configuration is successfully synchronized to the device, follow the prompts to open the corresponding mini program on the developer's device to perform the test operation, and click "Add to Cart" on the product details page ” button to report data. After the operation is completed, click "Sync Results". There may be a delay of 1-2 minutes.
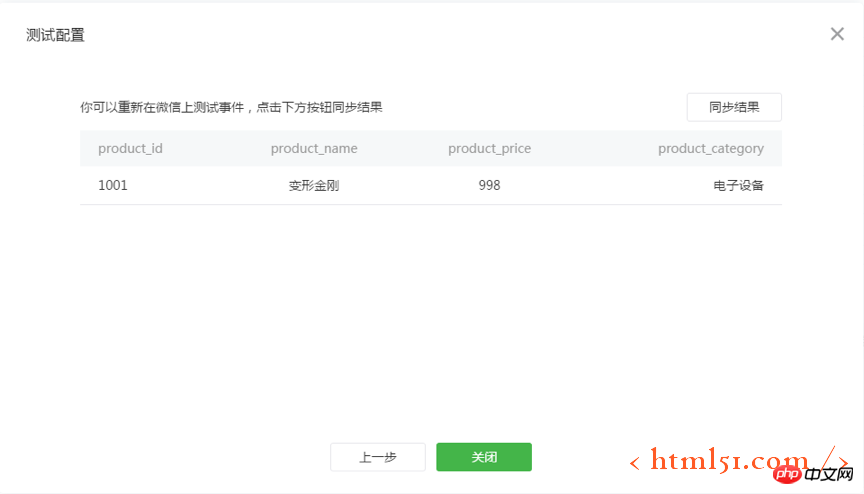
#After the data is successfully reported, the report details can be viewed in the current window. If the data is as expected, the test is considered successful and click "Close" to return to the event editing page.
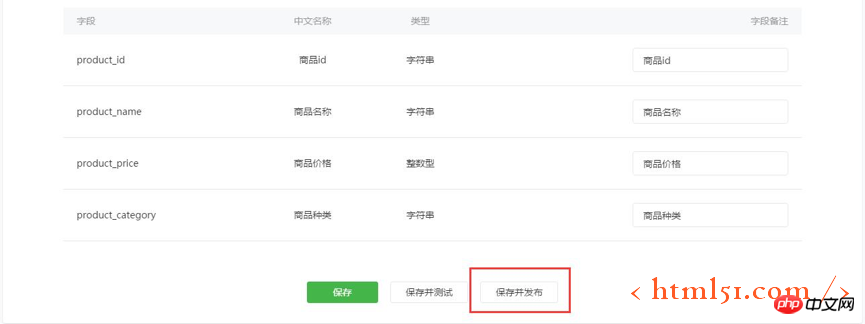
Click "Save and Publish" and confirm the operation. The event configuration will officially take effect. After about 5 minutes, you can start collecting data from all users. Note: After publishing, the names and data types of the existing fields of the event cannot be changed, but you can continue to modify the configuration and add new fields.
Similarly, you can define other events such as ordering and payment, publish event configurations, and collect data.
Analyze data
After publishing event configuration and collecting data, corresponding data analysis can be performed.
1. Count the order volume of users in different cities
Enter "Data Analysis" - "Custom Analysis" - "Event Analysis"
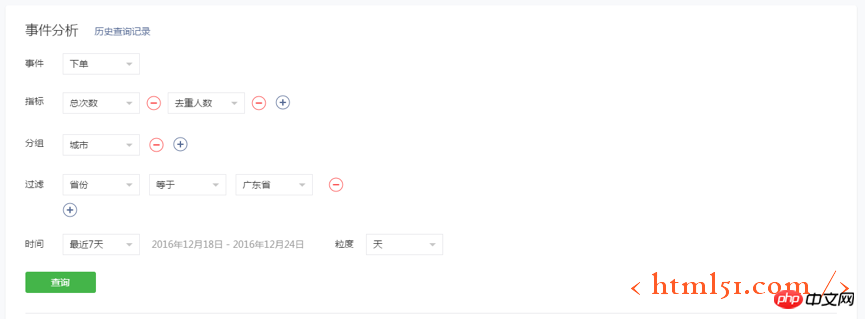
Event: Select " Place an order";
Indicators: Select "Total times" and "Number of people who place orders", that is, the number of times and the number of people who place orders, indicating the number of orders and the number of users who place orders;
Group: Select "City", that is Count the number of orders and the number of order users by city;
Filter: Data filtering conditions, for example, only count the data of Guangdong Province, then select the province equal to Guangdong Province, or you can not select it;
Time: Select the time range and The time granularity of the data, for example, view the data for each day of the last 7 days.
Click "Query" after completion.
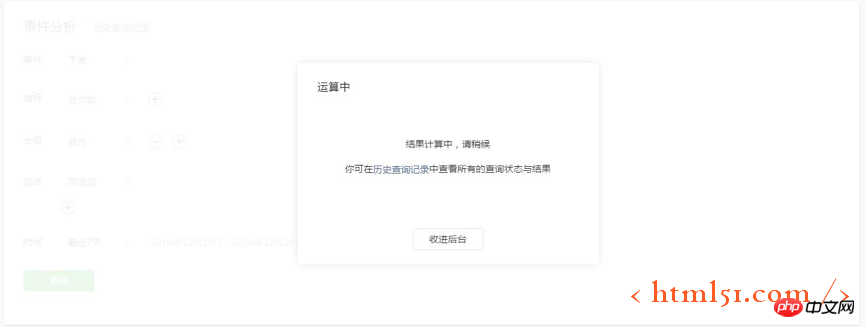
#The data starts to be calculated. Depending on the size of the data, there may be a certain waiting time. You can click "Add to background" to conduct a new query on the current page, or view previous data in the historical query records.
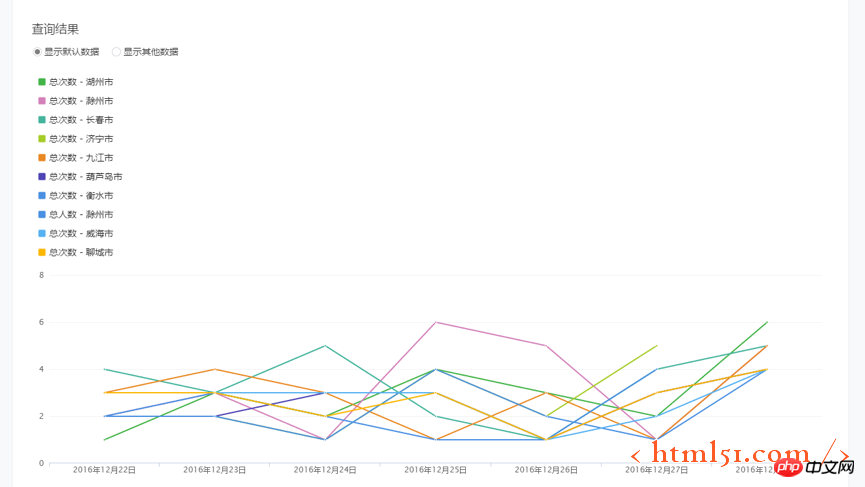
#After the statistics are completed, the current page will display the total number of orders and the total number of people in each city. Because there are too many grouping items, the chart only displays part of the data. You can set "Show other data" to select the cities and indicators you want to view; detailed data will display data for all cities and can be viewed or downloaded.
2. Conversion and loss of each step in the product purchase process
Enter "Data Analysis" - "Custom Analysis" - "Funnel Analysis"

When entering for the first time, click "New Funnel" to create a funnel.

#Fill in the name of the funnel and confirm a concise and clear name, which is conducive to corresponding analysis.

Set the funnel steps. Each step corresponds to an event. The steps in this funnel are to view the product - view details - add to shopping cart - place order - pay. After confirming each step, click "Add Step" in the lower right corner to continue adding the next step.

After completion, return to the data query page and set the query conditions.
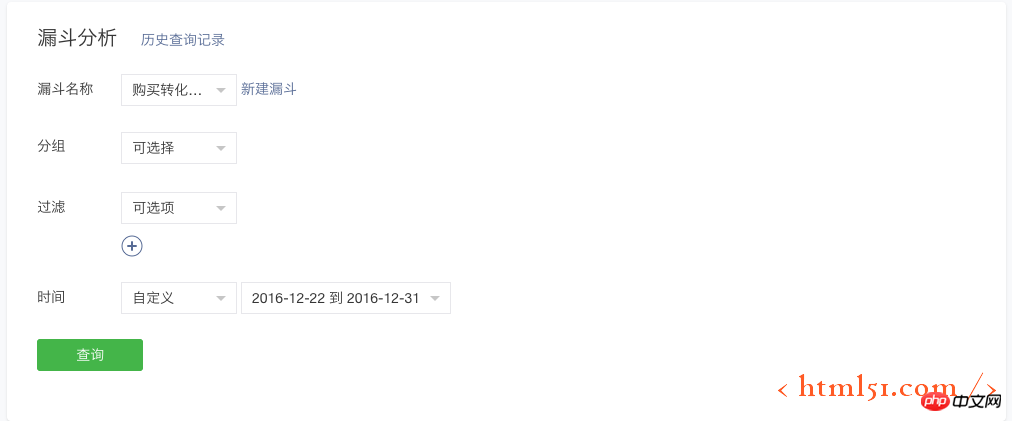
Funnel name: Select the created "Purchase Conversion Funnel";
Group: Select the fields that need to be grouped for statistics, or you can not select them. If not selected, the overall statistics will be counted;
Filtering: Data filtering conditions, such as Only count the data of Guangdong Province, then select the province equal to Guangdong Province, or you can not select it;
Time: Select the time range, and the overall funnel conversion situation within this range will be counted. Here, select 12.22-12.31.
Click Query to view the data results.
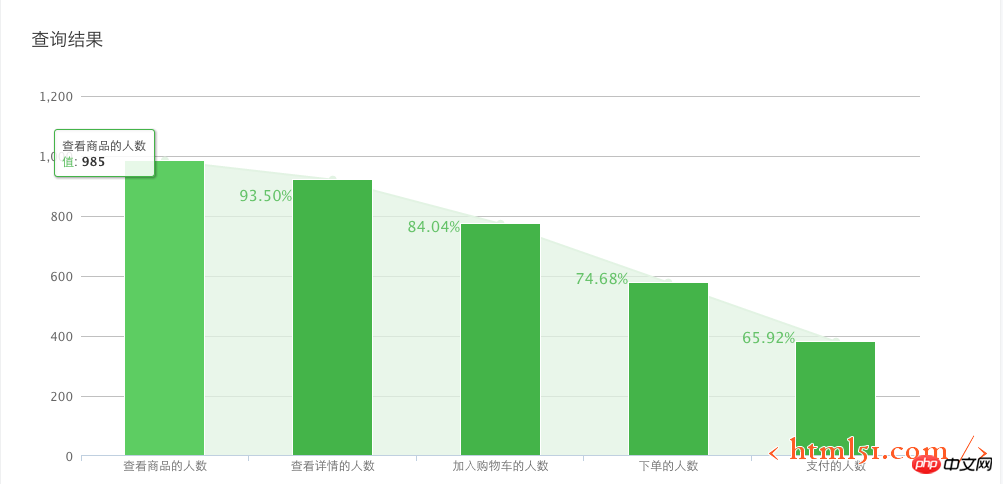
The chart shows that between 12.22 and 12.31, a total of 985 people viewed the product. The conversion rates of these users to each subsequent step are 93.50%, 84.04%, 74.68%, and 65.92%. The detailed data will show the specific data of each step, which can be downloaded and viewed.
Further, you can update the query conditions, such as setting grouping conditions and selecting the "City" field to view detailed funnel data for each city; setting filter conditions to view only the funnel conversion data of some selected users; extending the time range , you can see the conversion and churn of these users who viewed the product over a longer period of time.
The above briefly introduces how to use the custom analysis function to analyze user purchasing behavior. The details of the custom analysis function will be introduced below.
Event Management
Events and their fields
Events are models for custom analysis to collect and analyze user behavior data.
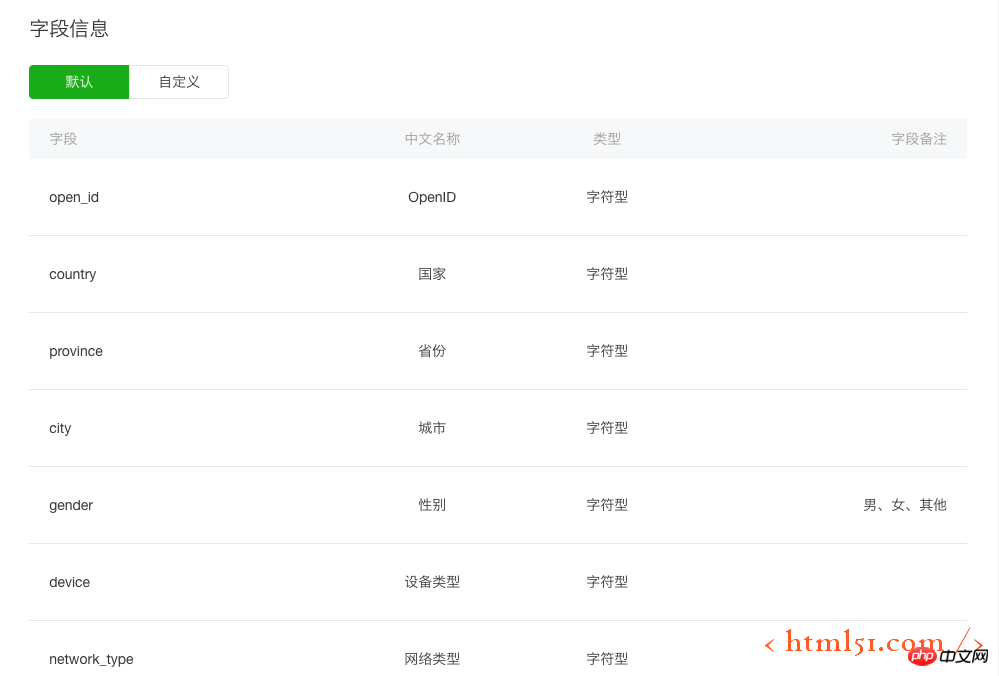
The data of an event is composed of multiple fields, including system default fields and user-defined fields.
The system default fields collect data from the system, such as user region, device type, etc.; while user-defined fields are specified and collected by the user.
The definition of the field is global, that is, event A uses field a, event B also uses field a, and the definition and description of a in events A and B are consistent.
On the "Data Analysis" - "Customized Analysis" - "Event Management" page, you can view the system default fields and existing user-defined fields.
Currently, the field type supports 32-bit integer and character types.
Event editing and publishing
You can create an event by adding a new event, modify the event to edit an event, and the event will only be collected after it is published. and analyze the data officially takes effect.

"Add event" can add new events.
"View release version" can see the currently officially released version of this event.
"Modify" can edit this event.
For more articles related to the WeChat Mini Program Data Analysis Guide, please pay attention to the PHP Chinese website!


