

 web3.0
What is an open contract in the currency circle? Why is it important in crypto futures trading? A detailed explanation of this article
web3.0
What is an open contract in the currency circle? Why is it important in crypto futures trading? A detailed explanation of this article
What is an open contract in the currency circle? Why is it important in crypto futures trading? A detailed explanation of this article

Table of contents
- What is open position (OI) in cryptocurrency futures trading?
- How open positions work in futures trading
- Open contracts and futures trading volume
- Why open contracts are important in cryptocurrency futures trading
- How to combine open positions with other technical indicators
- 1. Relative Strength Index (RSI) and Open Positions
- 2. Moving average and open position
- 3. Support and resistance levels
- 4. Trading volume and open position
- 5. Combining capital rate and open position
- Limitations of open positions in cryptocurrency futures trading
- in conclusion
- Open Position (OI) FAQ
- 1. What is open position (OI) in cryptocurrency futures?
- 2. How is the difference between open positions and trading volume?
- 3. Does the rise in open positions always mean that the market will rise?
- 4. Why do open positions sometimes fall when prices rise?
- 5. Can open positions predict trend reversal?
In cryptocurrency futures trading, a simple price cannot show how much participation is behind a change. Traders want to know whether funds are inflowing, outflowing, or simply rotating in the market. Open positions answer this question by measuring how many contracts are active.
Tracking open positions can help reveal whether new positions are being established, old positions are being closed, or whether market sentiment is changing. Making good use of it can distinguish lasting trends from short-term gains.
This article will explain what open position is in cryptocurrency futures, how it actually changes, how it differs from trading volume, and how it can be used in combination with indicators such as relative strength index, moving average, support and resistance, trading volume and capital rates.

What is open position (OI) in cryptocurrency futures trading?
Open positions (OI) in cryptocurrency futures refers to the total number of contracts active in the market. These contracts have not yet been settled or closed, meaning they remain part of the open positions driving activity. Unlike the volume that resets daily to show how many contracts are exchanged over a period of time, open positions are cumulative. It reflects the number of contracts currently unsettled.
A simple example can make this clearer. Suppose Trader A has established a long position in Bitcoin futures, while Trader B has taken the opposite side with a short position. Together they created a new contract, so the open position increased by one. After that, if both traders decide to close the position, the contract will be removed and the open position will be reduced by one.
As contracts are constantly being established and closed, open positions continue to rise and fall over the course of the day. An increase in open positions usually means more positions are being established—which usually means new funds are entering the market. A decrease in open positions means the contract is being closed, which may indicate that momentum is weakening.
How open positions work in futures trading
Open positions rise when new contracts are established and decrease when existing contracts are closed. If the contract only turns between traders, the open position will remain unchanged.
Openings for Ethereum (ETH) futures are approximately $1.54 billion, while Bitcoin (BTC) is $1.13 billion. Together, they account for a large portion of the total open position of US$4.27 billion on the entire platform.
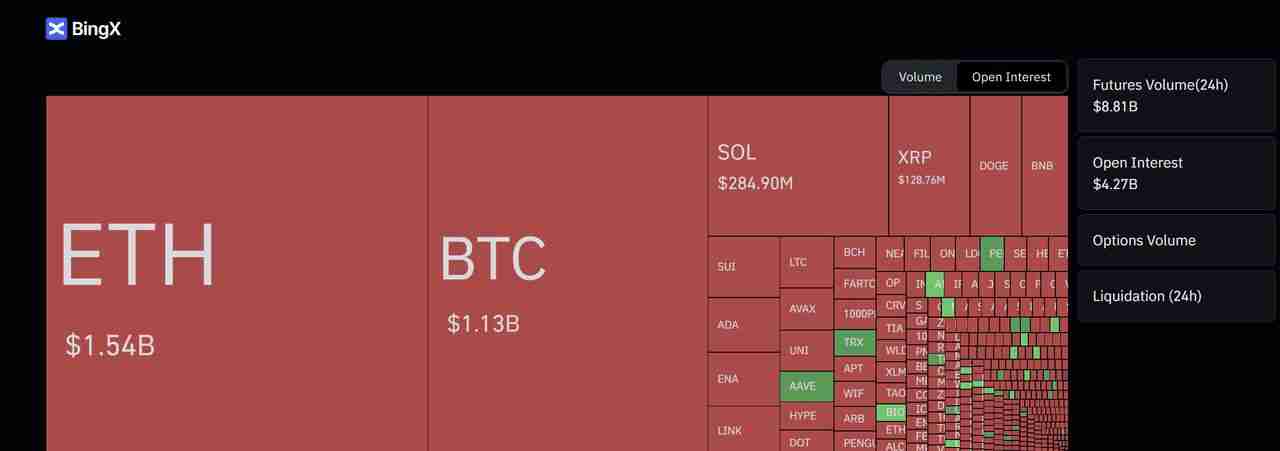
Open position - Source: Coinglass
Now consider two situations. If the open interest of ETH increases from $1.54 billion to $1.7 billion, and the price also rises, it shows that new contracts are being established and new funds are entering the market, which is a sign that participation is growing.
Open positions by trading pairs - Source: Coinglass
By contrast, if the BTC open contract falls below $1.13 billion from $1.13 billion and the price continues to rise, it means the contract is closing. This usually means that shorts are exiting, which may temporarily push up prices, but this rally may lack the lasting force due to no new positions entering the market.
This continued change in open positions will give traders a deeper understanding of how much belief is behind the price trend and whether market participation is increasing or shrinking.
Open contracts and futures trading volume
Open contracts and trading volume are often confused, but the two measure different things. Trading volume shows the number of contracts bought or sold over a specific time period. An open contract shows the number of contracts that have not been closed after the transaction.
Traders often combine the two:
• Price increases Trading volume increases Open contracts increase: The trend is strong and is usually a good time to follow the trend.
• Price increases Trading volume increases Open contracts decrease: Short positions are forced to close positions, and the rise may not last long. Be cautious before buying.
• Price drop trading volume increases Open contracts increase: new short positions enter the market, bearish momentum is increasing.
• Price drops, trading volume decreases, open contracts decrease: Traders are closing positions, and the trend may be weakening or ready to reverse.
In short, trading volume shows short-term activity, while open positions show lasting exposure. A market with high trading volume and increased open contracts usually has stronger participation than a market with flat open contracts.
Why open contracts are important in cryptocurrency futures trading
Open positions are important because it shows the participation behind price changes. The price itself will rise and fall, but open contracts can reveal whether traders are adding new contracts, closing existing contracts, or simply transferring positions.
If the price climbs and the open contract also rises, it means that new funds are entering the market and the trend has stronger support. If the price rises but the open contract falls, it means the contract is being closed, usually a short position, which may temporarily push up the price, but lack new commitments.
For traders, open positions are an emotional indicator. It helps to confirm whether the trend is strong, losing momentum, or risk of reversal, making it an important part of futures analysis.
How to combine open positions with other technical indicators
Open positions are powerful in themselves, but they become more valuable when combined with other indicators. Together, they provide traders with a clearer view of whether the trend has real power or whether it is likely to be exhausting momentum.
1. Relative Strength Index (RSI) and Open Positions
The relative strength index shows when the market is in a state of overbought (too many buyers) or oversold (too many sellers). Open positions show how many contracts are still active. When you combine the two, you can not only see if the market is in extreme state, but also if traders are still adding new positions or are retreating.
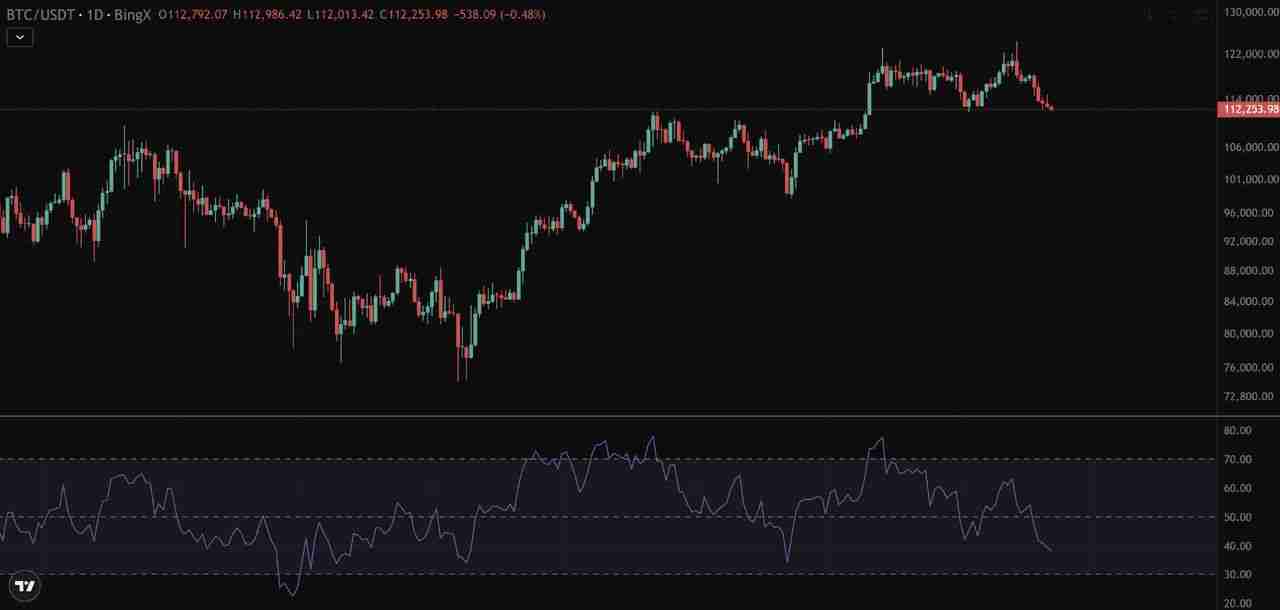
Source: BTC/USDT Perpetual Futures Contract
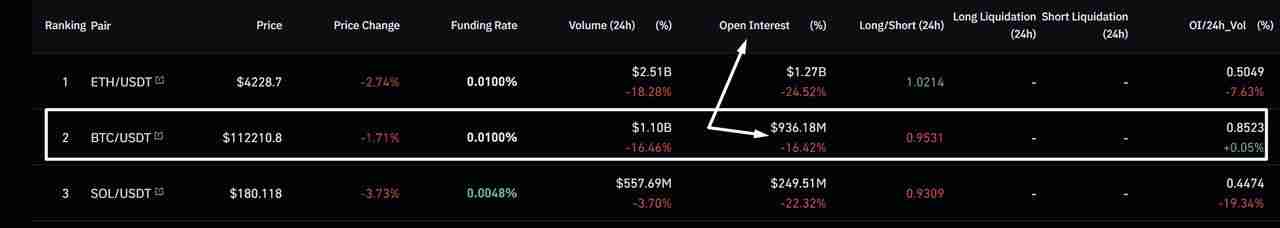
In the first chart, Bitcoin is trading around $112,253, while RSI has fallen below the 50 level, closer to the oversold area. This means that the selling pressure has been increasing.

Open contract interest rate - Source: Coinglass
Now let’s look at the BingX data in the second screenshot. Bitcoin’s open contract was $936 million, down more than 16% in 24 hours. This tells us that many traders have closed their futures positions when prices fall.
For traders, this combination conveys a clear message:
• RSI indicators show that kinetic energy is weakening.
• The decline in open positions confirms that traders are not actively adding new short positions; instead, they are closing positions.
Overall, these signals suggest that while Bitcoin is currently under pressure, there may be no firm belief behind the sell-off. Newbie can interpret it as a possible warning that the downtrend is losing momentum and that the price may find support soon.
2. Moving average and open position
The moving average smooths the price trend and helps traders see the overall trend. The 50-day moving average (red line) usually reflects the direction of the medium and short-term trend, while the 200-day moving average (blue line) shows the long-term trend.
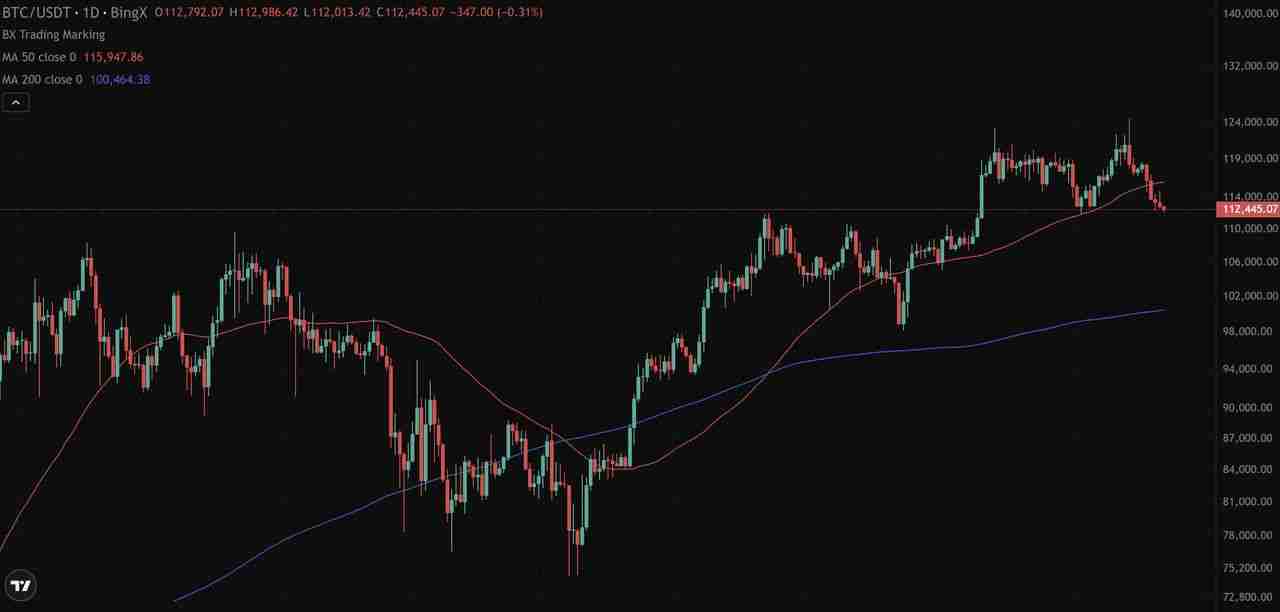
Source: BTC/USDT Perpetual Contract
In the first chart, Bitcoin is trading at about $112,445. It is still above the 200-day moving average (about $100,464), indicating that the long-term trend is still solid, but has fallen below the 50-day moving average (about $115,947). This shows weakness in the short-term trend.
Open interest rate - Source: Coinglass
Now check out the BingX data from the second screenshot. Bitcoin’s open position has dropped to about $936 million, down more than 16% in 24 hours. This means that many traders close positions when prices fall.
For traders, combining these signals can provide a clear interpretation:
• Price falls below the 50-day moving average shows that the short-term trend is weakening.
• The decline in open positions confirms that traders are closing positions instead of adding new positions, which means the decline has not received strong support from new funds.
Simply put, Bitcoin’s break below the 50-day moving average is usually a bearish signal. But as open positions are also declining, it suggests that there may not be enough belief behind the move. This could mean that selling pressure is waning, and the 200-day moving average will be the next key level to focus on.
3. Support and resistance levels
Support and resistance levels show the level that prices have been difficult to break through in history. Open positions help confirm whether traders believe that these levels will be held or broken through.
In the chart, Bitcoin is trading at about $112,360, which happens to be in a major support area near $111,800. Prices have tested this level several times before, making it a key area for traders.
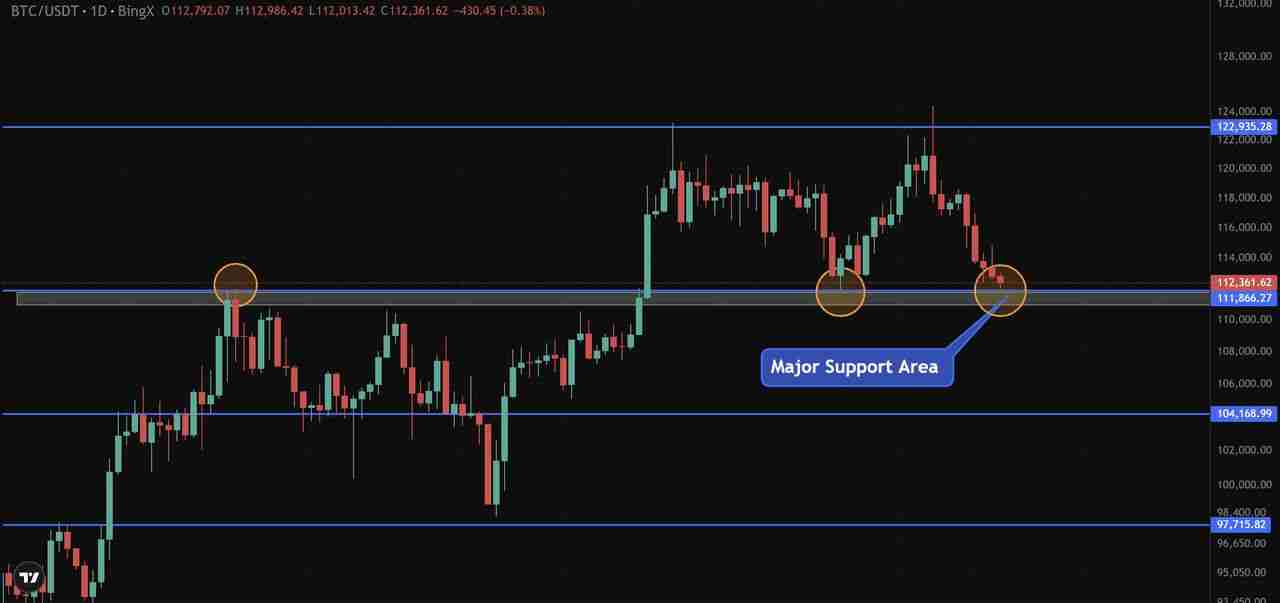
Source: BTC/USDT Perpetual Contract
We continue to use the same BTC/USD open position data. Bitcoin futures open positions have recently fallen to about $936 million, down 16% in 24 hours. This shows that when Bitcoin slides to support, many positions are closed.
The interpretation is as follows:
• If Bitcoin maintains above the $111,800 support level and open positions begin to rise again, it will indicate that buyers are entering with confidence to establish new long positions. This will strengthen the possibility of a rebound.
• But if the price hovers at the support level and the open position continues to fall, it indicates that the trader is retreating rather than defending the level. In this case, support will become weaker and may then fall to lower areas such as $104,000.
In short, combining support/resistance with open positions can tell the trader whether a level is being defended by real funds or whether the position is closing and belief is shaking.
4. Trading volume and open position
Volume shows the scale of trading activity, while open positions reveals how many contracts are still open. Combining the two will help traders determine whether market changes are supported by lasting positions or simply short-term activity.
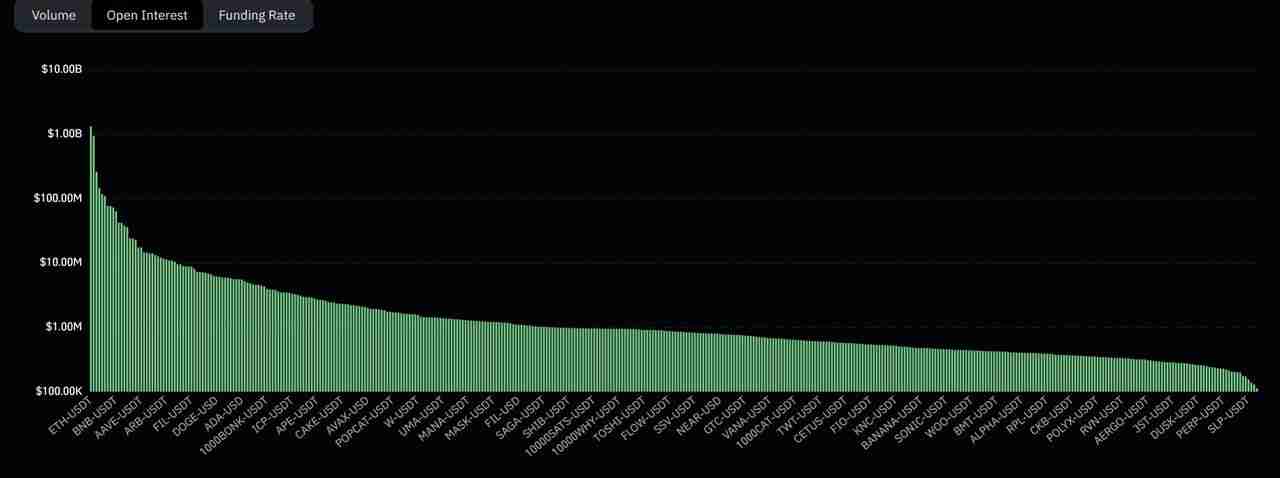
This can be clearly seen from BingX's data. In the volume chart, Ethereum (ETH) futures lead with 24-hour volume of $2.92 billion, followed by Bitcoin (BTC) $1.32 billion and Solana (SOL) $624 million. These figures reflect the level of activity in various markets that day.
In the open position chart, ETH is shown at $1.52 billion, BTC is $1.13 billion and SOL is $282 million. These lower numbers highlight how many contracts remain open after trading rather than being closed.
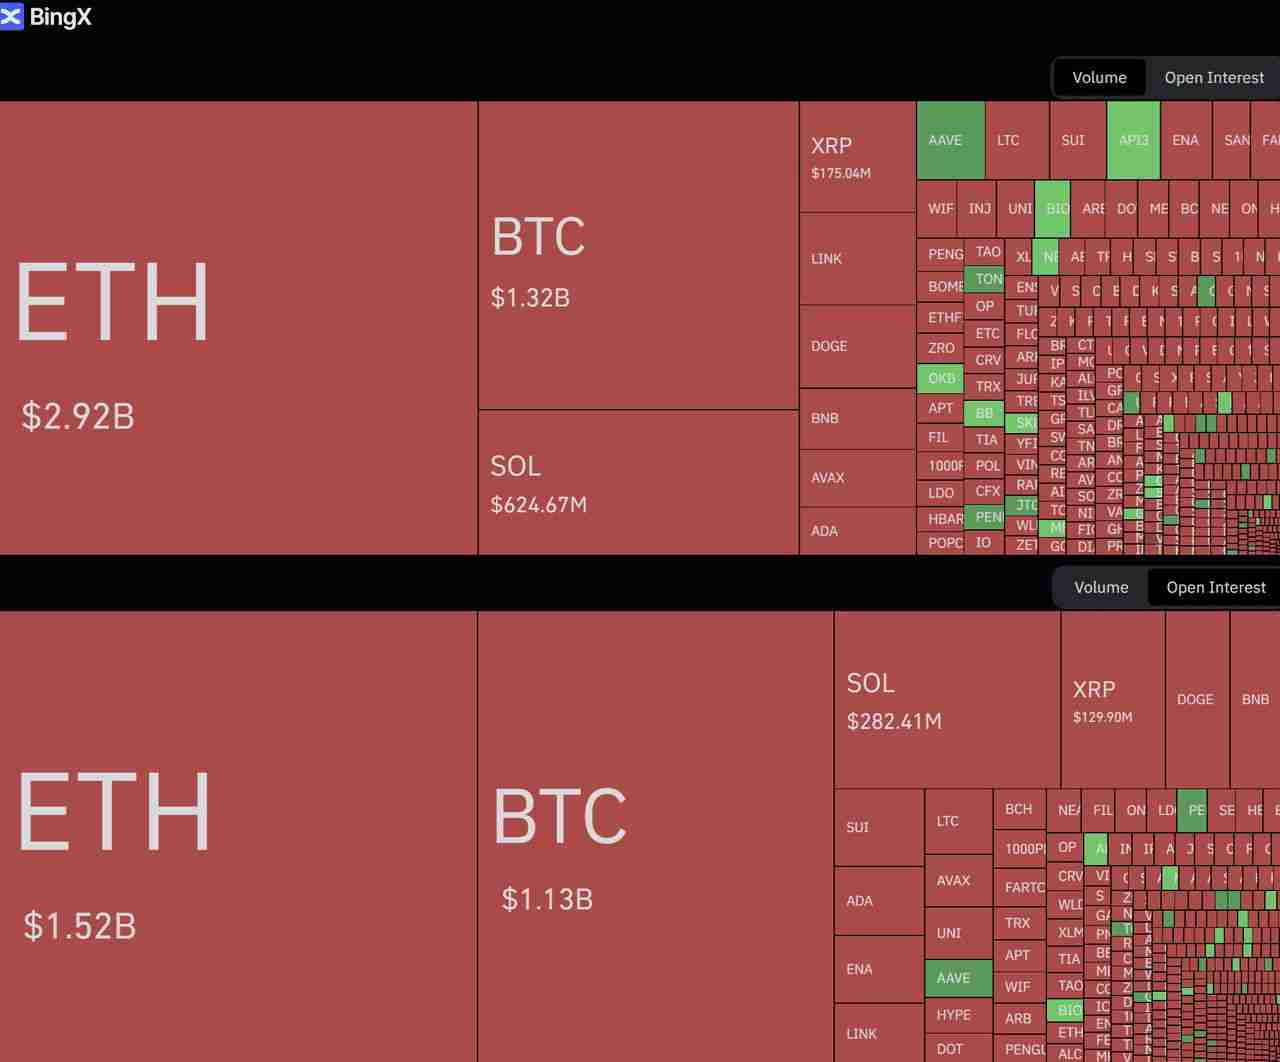
Open position and trading volume—Source: Coinglass
Taking Ethereum (ETH) as an example, its daily trading volume of futures reached US$2.92 billion, but its open position was US$1.52 billion. This means that many traders are in and out quickly without establishing lasting positions. If the price of ETH is rising during this period, but the open position remains unchanged, then this wave of upward trend may come from short-term trading or liquidation rather than the establishment of new positions.
On the other hand, if the volume remains high and the open position increases from $1.5 billion to $1.8 billion, it means that the trader is not only active, but also continues to hold the contract. This means there is greater participation behind the trend, making the trend more reliable.
Combining these two, traders can judge whether the high activity in the market comes from the continuous retention of funds or simply a quick turnover, and lack sufficient belief.
5. Combining capital rate and open position
In perpetual contracts, the capital rate is a small fee paid by long and short traders to make the contract price as close to the spot market as possible. Positive capital rates mean longs pay to shorts, while negative capital rates mean shorts pay to longs.
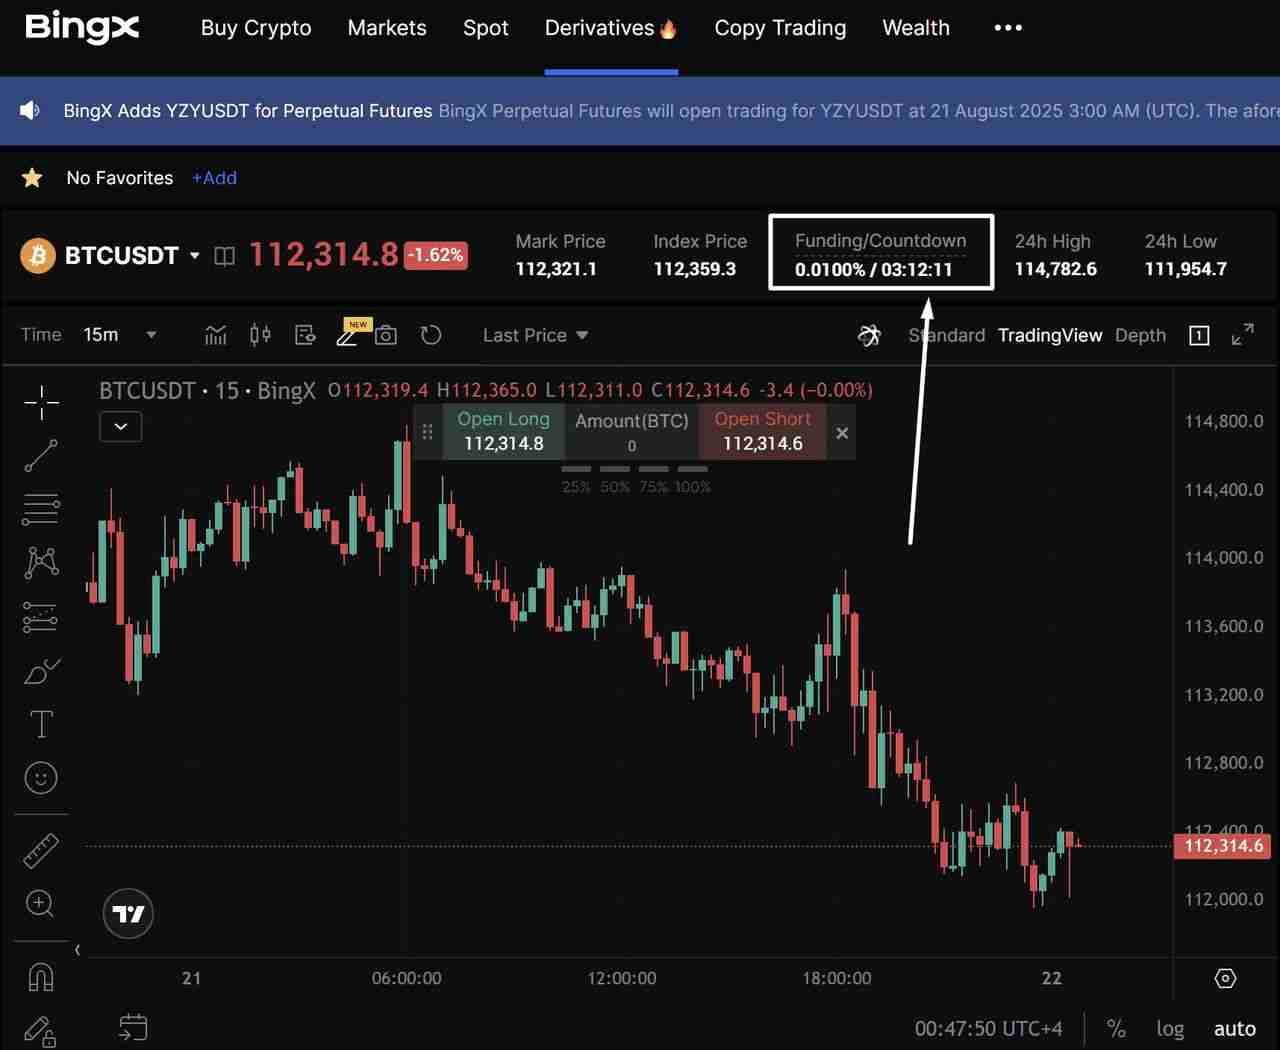
Source: BTC/USDT Perpetual Contract
The chart shows that Bitcoin is trading at about $112,314 with a funding rate of 0.0100%. This rate is positive, indicating that the long trader is currently paying fees to the shorts to maintain the position. This usually happens when bullish sentiment is strong.

Open position fee rate - Source: Coinglass
Now link this to the open position data we mentioned earlier, Bitcoin’s open position has fallen 16% to about $936 million. This means that while longs pay premiums to shorts, many traders have been closing positions rather than building new positions.
This provides an important clue for traders:
• If the funding rate remains positive and open positions rises, this means that long positions are being actively established. Although this can push up prices, if the price suddenly falls, it can also cause a risk of "long squeeze", resulting in excessive leverage long positions being forced to close.
• If the fund rate is positive but the open position drops (as in this case), this indicates that the trader is retreating. This means that bullish sentiment may be difficult to hold onto its level without the strong support of new funds.
In this case, the price of Bitcoin fell from $114,700 to $112,300, but the funding rate was still positive while the open position was decreasing, indicating that the longs were paying fees to maintain their positions, but the market did not add new contracts. This weakens the bullish reason and explains why prices continue to fall.
Limitations of open positions in cryptocurrency futures trading
Although open positions are useful, they are not complete when used alone. The increase in open positions shows that new contracts have been opened, but it does not reveal whether these contracts are long or short. Strong long and short bets will increase open positions, so their direction must be confirmed through other data.
It may also lag behind rapid price movements. In heavily volatile markets, open positions may only occur after price changes have occurred, limiting its use as an instant signal.
Finally, open positions are inconsistent across exchanges. A decline in a platform may simply mean that traders move their parts elsewhere, rather than weakening overall market sentiment.
Due to these limitations, traders rarely use open positions alone. It works best when combined with price behavior, transaction volume, capital rate and other indicators.
in conclusion
Open positions are a core indicator of crypto futures because it shows how many contracts are active and how much engagement supports a trend. While it cannot itself show whether a trader is long or short, it helps to confirm whether the momentum is building or fading when used in conjunction with tools such as volume, capital rates, moving averages, RSI, and support or resistance levels.
The real value of open positions lies in its context. It shows that funds are entering, leaving or simply rotating in the market. When used with other indicators, it gives traders a clearer signal and a deeper understanding of market dynamics.
Open Position (OI) FAQ
1. What is open position (OI) in cryptocurrency futures?
Open position volume refers to the total number of active contracts in the futures market that have not yet been settled or closed.
2. How is the difference between open positions and trading volume?
The volume shows how many contracts were traded in a specific time period, while the open position shows how many contracts were still active after the transaction.
3. Does the rise in open positions always mean that the market will rise?
No. The rise in open positions means more contracts are opened, but they can be long or short. It is just a signal of participation, not a guarantee of direction.
4. Why do open positions sometimes fall when prices rise?
This usually means that shorts are closing positions. Short closings can temporarily push up prices, but this upward trend may lack momentum due to no new contracts being added.
5. Can open positions predict trend reversal?
Cannot be used alone. However, when open positions suddenly drop and accompanied by a weakening of trading volume, it usually indicates that a trend is losing momentum and may reverse.
What is an open contract in the currency circle? Why is it important in crypto futures trading? This is the article that explains the details. For more information about the introduction of open positions, please search for previous articles on this site or continue to browse the related articles below. I hope everyone will support this site in the future!
The above is the detailed content of What is an open contract in the currency circle? Why is it important in crypto futures trading? A detailed explanation of this article. For more information, please follow other related articles on the PHP Chinese website!

Hot AI Tools

Undress AI Tool
Undress images for free

Undresser.AI Undress
AI-powered app for creating realistic nude photos

AI Clothes Remover
Online AI tool for removing clothes from photos.

Clothoff.io
AI clothes remover

Video Face Swap
Swap faces in any video effortlessly with our completely free AI face swap tool!

Hot Article
Hot Tools

Notepad++7.3.1
Easy-to-use and free code editor

SublimeText3 Chinese version
Chinese version, very easy to use

Zend Studio 13.0.1
Powerful PHP integrated development environment

Dreamweaver CS6
Visual web development tools

SublimeText3 Mac version
God-level code editing software (SublimeText3)


 What is Mango Network (MGO Coin)? MGO's future development and price forecast
Sep 02, 2025 pm 08:57 PM
What is Mango Network (MGO Coin)? MGO's future development and price forecast
Sep 02, 2025 pm 08:57 PM
Directory What is MangoNetwork (MGO Token)? Technical advantages (1) Excellent performance (2) Main features of safe and reliable MangoNetwork 1. Parallel execution architecture of multiple virtual machines 2. Advanced cross-chain communication 3. High-performance consensus mechanism 4. Enhanced security through the Move language 5. Modular blockchain design How MangoNetwork operates MGO token Economics Token allocation details: Unlocking and release timetable: MangoNetwork Roadmap and Future Development MangoNetwork Price Forecast MangoNetwork 20
 HYPE trading volume crushes the giant, and is actually the 'most underrated dark horse' in the L1 public chain? One article analysis
Sep 02, 2025 pm 09:03 PM
HYPE trading volume crushes the giant, and is actually the 'most underrated dark horse' in the L1 public chain? One article analysis
Sep 02, 2025 pm 09:03 PM
1. Hyperliquid trading volume "sky": spot perpetual double-line overtakes Recently, the trading activity of the decentralized exchange Hyperliquid has ushered in explosive growth, and its market performance has posed a significant challenge to traditional centralized platforms. Spot trading volume jumped: On August 24, Hyperliquid attracted market attention due to a large-scale asset conversion transaction - an unknown address deposited about 22,100 BTC and exchanged positions to 555,000 ETH, with a transaction volume of more than US$2.4 billion. This move directly pushed its BTC spot trading volume to the second largest in the world on the day, with a market share of 12%, second only to Binance's 38%. Compared with the previous average daily share of about 1%, the growth is extremely significant. Perpetual contracts continue to lead: Hyper
 BNB Certification Service (BAS Coin) 2025–2030 Price Forecast: How much will the price reach in the future?
Sep 02, 2025 pm 07:00 PM
BNB Certification Service (BAS Coin) 2025–2030 Price Forecast: How much will the price reach in the future?
Sep 02, 2025 pm 07:00 PM
Table of Contents What is the latest news and updates of BAS coins? What is BAS coin introduced by the BNB certification service development team? BAS Token Economics BNB Certification Service (BAS) Price Forecast 2025–2030BNB Certification Service (BAS) Price Forecast Bollinger Bands and Momentum Indicators BNB Certification Service (BAS) Price Forecast 2025–2030BNB Certification Service (BAS) Price Forecast 2026 Price Forecast BNB Certification Service (BAS) Price Forecast
 How to authenticate the Ouyi Exchange account? OKX Identity Authentication Newbie Guide 2025
Sep 02, 2025 pm 09:00 PM
How to authenticate the Ouyi Exchange account? OKX Identity Authentication Newbie Guide 2025
Sep 02, 2025 pm 09:00 PM
Why real-name authentication compliance requirements At present, global supervision of the financial field is becoming increasingly strict, especially in terms of capital flow. In order to comply with relevant regulations on international anti-money laundering (AML) and anti-terrorism financing (CFT), real-name authentication has become a necessary part of compliance operations. Through identity verification, the OKX platform can ensure that its services comply with the legal frameworks of various countries, especially with a legitimate basis when handling cross-border transactions. Ensure transaction security Real-name authentication can effectively prevent identity impersonation and fraud and improve the security of the transaction process. By verifying the user's true identity, the system can identify and prevent illegal funds from flowing in or out, thereby effectively protecting users' digital assets from infringement. Improve service quality After confirming the user's identity, the platform can provide more accurate service support.
 WLFI coins will be launched on September 1st, why is WLFI worth watching? A detailed explanation of this article
Sep 02, 2025 pm 08:45 PM
WLFI coins will be launched on September 1st, why is WLFI worth watching? A detailed explanation of this article
Sep 02, 2025 pm 08:45 PM
Table of Contents 1. Project Brief Analysis 2. Why is USD1 not an ordinary stablecoin? 3. Issuing news 4. Institutional participants and their financial strength 5. Why is this structure prone to surge 6. Risks that cannot be ignored 7. Quick view of peripheral bets 8. Core conclusions A stablecoin supported by US Treasury bonds, a governance token nourished by its own reserves, and behind it is the US presidential family! Also, its initial circulation volume is only 5%. On September 1, WorldLibertyFi will release its governance token WLFI. For some, this is a complete restructuring of the stablecoin value capture model. For others, this is nothing more than a scene
 What is Cronos (CRO coin)? Is it a good investment? Future price forecast of CRO coin
Sep 02, 2025 pm 08:51 PM
What is Cronos (CRO coin)? Is it a good investment? Future price forecast of CRO coin
Sep 02, 2025 pm 08:51 PM
Contents What is Cronos (CRO) How many CROCRO coins are there Main functions CRO and Solana Comparison of the technical team behind CRO and the origins Important news and events Is CRO a good investment CRO long-term price forecast CRO2025 price forecast CRO2026-2031 price forecast CRO2031-2036 price forecast FAQ Cronos (CRO) is a native token of the Cronos ecosystem, and the project is well known for its position at the intersection of Ethereum and Cosmos blockchains. As a basis
 What is Reploy (RAI Coin)? RAI future outlook and price forecast
Sep 02, 2025 pm 08:39 PM
What is Reploy (RAI Coin)? RAI future outlook and price forecast
Sep 02, 2025 pm 08:39 PM
Directory What is Reploy? Reploy’s main highlights: Reploy’s reasons why Reploy stands out recently Reploy Overview How Reploy works? How Reploy Editor Helps Developers Write Optimized Code How ReployLLM Provides Advantages to Web3 Developers How Reploy's AI Agent Automate Blockchain Tasks Possible Token Uses Financing Details Reploy's Token Economics Is Reploy worth buying? Risks that rising potential need to be weighed Reploy Price Forecast Reploy 2025 Price Forecast Reploy
 How is Bitcoin's recent performance? Review of Bitcoin's 10-year price and future trend analysis
Sep 02, 2025 pm 08:30 PM
How is Bitcoin's recent performance? Review of Bitcoin's 10-year price and future trend analysis
Sep 02, 2025 pm 08:30 PM
Table of Contents Recent Bitcoin Price Performance Recent Price Volatility Causes Analysis of Macroeconomic Factors Regulatory Policy Dynamics Technical Factors Market Sentiment and Investor Behavior Bitcoin 10 Years Price Review Future Trend Forecast Investor Reference Strategy Summary Bitcoin (BTC) As one of the most influential crypto assets in the world, its price fluctuations have always attracted much attention. According to the latest data, the real-time price of Bitcoin is $112,954, with trading volume reaching $64,081,589,151 in the past 24 hours, an increase of 1.74%. Bitcoin market capitalization is approximately US$2,249,221,777,686, circulating and supplying