

 web3.0
How do you view the three lines for cryptocurrency trading? What do the three K lines mean?
web3.0
How do you view the three lines for cryptocurrency trading? What do the three K lines mean?
How do you view the three lines for cryptocurrency trading? What do the three K lines mean?

在数字货币的交易分析中,图表上的各种线条和图形是交易者用来解读市场动态的重要工具。人们常说的“三条线”和“三根K线”是两种不尽相同的技术分析概念。前者通常指代的是移动平均线(Moving Average),而后者则指由三根独立的K线(Candlestick)组成的特定形态。理解这两组概念,对于分析图表走势具有基础性的作用。

移动平均线(MA)的基本构成
1、移动平均线,简称均线(MA),是通过计算特定时间周期内的收盘价平均值,并将这些平均值连接起来形成的曲线。它能够平滑价格波动,显示出价格在一段时间内的总体运动方向。交易者常常在图表中设置不同周期的均线,例如5日线、10日线、30日线、60日线等。
2、不同周期的均线代表了不同的市场观察维度。短期均线(如5日、10日线)对价格变化反应非常灵敏,能够迅速捕捉到价格的短期波动。中期均线(如30日线)则过滤掉了部分短期噪音,反映了中期趋势的变化。长期均线(如60日、120日线)反应最为迟缓,但它所指示的长期趋势方向具有较高的稳定性。这三类均线共同构成了观察市场的立体视角。
3、均线的主要作用是揭示趋势和作为支撑或阻力参考。当价格运行在均线上方时,该均线可能扮演支撑的角色;当价格运行在均线下方时,该均线则可能形成阻力。交易者通过观察价格与均线的位置关系,来判断当前市场的强弱态势。
三条移动平均线的组合应用
1、当短期、中期、长期三条均线按照从上到下的顺序排列,并且均同步向上发散时,这种形态被称为“多头排列”。它通常被解读为市场处于一个较为强劲的上升阶段,买方力量占据主导地位。在这种排列下,价格回调至下方的均线附近时,常常会获得支撑。
2、与多头排列相反,当短期、中期、长期三条均线按照从下到上的顺序排列,并且均同步向下发散时,这种形态被称为“空头排列”。这一般意味着市场处于下降通道中,卖方力量较强。在这种情况下,价格反弹至上方的均线附近时,可能会遇到阻力。
3、均线之间的交叉是重要的交易信号。当短期均线从下方向上穿越长期均线时,形成的交叉点被称为“金叉”(Golden Cross),这被看作是一个积极的信号。反之,当短期均线从上方向下穿越长期均线时,形成的交叉点被称为“死叉”(Death Cross),这被视为一个消极的信号。不同周期的均线组合形成的交叉,其代表的市场意义强度也有所不同。

常见的三根K线组合形态
1、三根K线组合形态是基于K线理论的特定价格行为模式,它通过连续三根K线的形态、颜色和相对位置来解读市场参与者的心理变化和力量对比。与平滑的均线不同,K线组合更加关注短时间内的价格行为细节和转折点。
2、“红三兵”(Three White Soldiers)是一种看涨的K线组合。它由三根连续的阳线(通常在图表中显示为绿色或白色)组成,每一根K线的收盘价都高于前一根的收盘价,并且每根K线的开盘价都位于前一根K线实体之内。这种形态的出现,表明买方力量持续增强,逐步推高价格。
3、“三只乌鸦”(Three Black Crows)是与红三兵相反的看跌形态。它由三根连续的阴线(通常显示为红色或黑色)组成,每根K线的收盘价都低于前一根的收盘价,且开盘价位于前一根K线实体之内。该形态显示出卖方力量的持续主导,价格可能面临下行压力。
4、除了上述两种趋势延续形态,还存在一些预示行情可能反转的组合。例如“早晨之星”(Morning Star),它通常出现在下跌行情的末端。其构成为:第一根是长阴线,第二根是实体较小的K线(可以是阳线或阴线,形成一个星形),第三根是深入第一根阴线实体的长阳线。这个组合暗示下跌动能衰竭,买方开始接管市场。与之对应的“黄昏之星”(Evening Star)则出现在上涨行情中,预示着可能的顶部反转。
The above is the detailed content of How do you view the three lines for cryptocurrency trading? What do the three K lines mean?. For more information, please follow other related articles on the PHP Chinese website!

Hot AI Tools

Undress AI Tool
Undress images for free

Undresser.AI Undress
AI-powered app for creating realistic nude photos

AI Clothes Remover
Online AI tool for removing clothes from photos.

Clothoff.io
AI clothes remover

Video Face Swap
Swap faces in any video effortlessly with our completely free AI face swap tool!

Hot Article
Hot Tools

Notepad++7.3.1
Easy-to-use and free code editor

SublimeText3 Chinese version
Chinese version, very easy to use

Zend Studio 13.0.1
Powerful PHP integrated development environment

Dreamweaver CS6
Visual web development tools

SublimeText3 Mac version
God-level code editing software (SublimeText3)


 Solana price forecast for August 2025
Aug 07, 2025 pm 11:21 PM
Solana price forecast for August 2025
Aug 07, 2025 pm 11:21 PM
There are three scenarios for Solana price forecast in August 2025: 1. In an optimistic scenario, if the network stability improves and the ecology is prosperous, the price can reach $550-$800; 2. In a neutral scenario, the network is stable and the ecology is steadily developing, with a price range of $300-$500; 3. In a pessimistic scenario, if network problems occur frequently, the ecology shrinks and encounters a bear market, the price may fall back to $100-$250; Investors can choose platforms such as Binance, Ouyi, Huobi, Gate.io, KuCoin or Coinbase for trading, which provide good liquidity and security, suitable for different types of investors to participate in the Solana market.
 How to use 5,000 yuan to earn 500,000 yuan in the currency circle?
Aug 07, 2025 pm 08:42 PM
How to use 5,000 yuan to earn 500,000 yuan in the currency circle?
Aug 07, 2025 pm 08:42 PM
In the field of digital currency, a full range of variables and opportunities, increasing the principal of 5,000 to 500,000 means that one hundred times the asset appreciation needs to be achieved. This is not a simple math game, but a comprehensive test involving cognition, strategy, mentality and execution. It requires participants not to rely solely on luck, but also to have keen market insight and extraordinary risk management capabilities.
 What is Bitcoin (BTC)? A brief introduction to what is Bitcoin
Aug 07, 2025 pm 10:48 PM
What is Bitcoin (BTC)? A brief introduction to what is Bitcoin
Aug 07, 2025 pm 10:48 PM
Bitcoin (BTC) is a digital asset created and run based on cryptography principles. It does not rely on specific central institutions, such as banks or governments, to issue and manage. Its concept was first proposed in 2008 by an individual or group named "Satoshi Nakamoto" in a paper titled "Bitcoin: A peer-to-peer electronic cash system."
 Dogecoin DOGE price forecast: 2025, 2026 - 2030
Aug 08, 2025 pm 07:54 PM
Dogecoin DOGE price forecast: 2025, 2026 - 2030
Aug 08, 2025 pm 07:54 PM
Dogecoin (DOGE) is expected to reach an optimistic range of $0.40 to $0.80 in 2025, provided that the market enters a bull market and has substantial application, otherwise it may hover between $0.10 and $0.25; 1. The price in 2025 is driven by market cycles and celebrity effects, especially depending on whether Elon Musk-related companies use DOGE payments; 2. It may experience a bull market correction from 2026 to 2027, and the price will decline significantly; 3. By 2030, if DOGE can expand a wide range of application scenarios and improve technical performance, the long-term price may be stable at $1.00 or even higher; 4. If it cannot be transformed into a practical asset and only rely on the community and celebrity effects, its attractiveness may weaken, and the price will stagnate for a long time or be emerging.
 What is the Genius Act? What is the impact? Can stablecoins save US dollar and US debt?
Aug 08, 2025 pm 10:54 PM
What is the Genius Act? What is the impact? Can stablecoins save US dollar and US debt?
Aug 08, 2025 pm 10:54 PM
The Genius Act strengthens the linkage between stablecoins and US dollar and US bonds by establishing a federal regulatory framework and requiring stablecoins to hold US dollars or US bonds 1:1 as reserves; 1. The bill clearly defines payment stablecoins and implements AML/KYC supervision; 2. The issuance of stablecoins will increase the demand for short-term US bonds, which may significantly affect the US bond market and yield; 3. The development of stablecoins not only improves cross-border payment efficiency, but also brings systemic risks and challenges to the traditional banking system, which may change the global financial landscape.
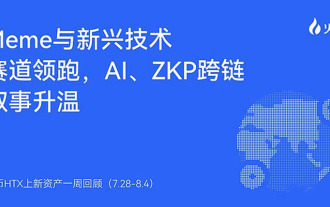 Huobi HTX's new assets in one week (7.28-8.4): Multi-track resonance Meme and AI concepts lead the market
Aug 08, 2025 pm 11:03 PM
Huobi HTX's new assets in one week (7.28-8.4): Multi-track resonance Meme and AI concepts lead the market
Aug 08, 2025 pm 11:03 PM
Table of Contents Meme's popularity remains: VINE and DONKEY continue to rise. Technical narrative heats up: AI and privacy computing are popular across chains, RWA and regional narrative: OMNI's emerging star Huobi HTX wealth effect continues to be released. Regarding Huobi HTX From July 28 to August 4, the global crypto market maintained a volatile pattern, and the pace of hot spot rotation accelerated. Among the assets launched by Huobi HTX this week, Meme, AI, privacy computing, cross-chain and RWA have advanced together, and the market wealth effect continues to appear. This is also the fifth consecutive week since July that Huobi HTX has achieved collective increase in new assets, further verifying its forward-looking nature in cutting-edge project mining and ecological layout, and continuing to provide strong support for users to grasp the new round of market cycle. Huobi (HTX
 What is cryptocurrency trading volume? What is the use of trading?
Aug 08, 2025 pm 11:12 PM
What is cryptocurrency trading volume? What is the use of trading?
Aug 08, 2025 pm 11:12 PM
Table of Contents What is trading volume? The relationship between trading volume and price What is the use of trading volume for trading? Things to note when using trading volume 1. The amplification of trading volume is not necessarily a favorable one 2. The abnormal trading volume must be interpreted with fundamentals and news 3. The interpretation of trading volume at different market stages is extremely different 4. Pay attention to the possibility of trading volume fraud (fake volume, brush volume, lightning trading) 5. The trading volume of small caps and unpopular stocks is limited in reference 6. The trading volume must be analyzed in a comprehensive analysis of price patterns and technical indicators OANDA provides a unique "position data chart" OANDA open-Position trading principle and application? The first quadrant
 How to make 300,000 yuan with 3,000 yuan in the currency circle? Ultimate actual combat
Aug 07, 2025 pm 08:36 PM
How to make 300,000 yuan with 3,000 yuan in the currency circle? Ultimate actual combat
Aug 07, 2025 pm 08:36 PM
From three thousand to three hundred thousand means seeking a hundred times the reward. This is not a fantasy in the crypto world, but it requires the executor to have a very high level of cognition, a tough mindset and precise operation. This is not a comfortable road, but a high-risk and high-reward game. The path to this goal requires careful design and strict implementation.