

 web3.0
What is the K-line? How to view the Bitcoin K-line chart? Analysis of common K-line patterns
web3.0
What is the K-line? How to view the Bitcoin K-line chart? Analysis of common K-line patterns
What is the K-line? How to view the Bitcoin K-line chart? Analysis of common K-line patterns

Table of contents
What is the essence of the K-line chart?
The core component of the K-line
Time cycle and the uniqueness of the Bitcoin market:
Advantages of K-line charts over ordinary price curves
How to interpret a single K-line? Analysis of typical forms and practical signals
Large entity and short shadow K-line meaning (strong entry or kinetic energy failure)
The meaning of long shadow line and small entity K-line (trend turning point or market hesitation)
Two forms appear one after another (the probability of changing the disk increases significantly)
Where to view the Bitcoin K-line chart?
How many minutes should I look at the K-line? Only by choosing the right time period can you grasp the trend direction
Frequently Asked Questions about Bitcoin K-line Chart Q&A
Conclusion: Master the basics of K-lines and move towards the path of advanced technical analysis
What do you think of a bitcoin K-line if you want to get started quickly? K-line chart is a tool that visualizes price fluctuations and is widely used in financial trading scenarios such as stocks, gold, crude oil and cryptocurrencies.
Understanding the K-line structure is the basic skill of technical investors. Compared with a simple price link chart, it can provide richer market information.
This article will take you to understand the principles of K-line charts from scratch, the practical application of Bitcoin K-line charts, common form recognition techniques, and teach you how to choose the appropriate time period based on your own trading habits.
What is the essence of the K-line chart?
K-line chart (also known as candle chart) is a graphical way to record changes in asset prices. Each K-line contains four key data: opening price, closing price, highest price and lowest price. It is one of the most basic and important tools in technical analysis and is widely used in the stock market, foreign exchange, commodity and digital currency markets.
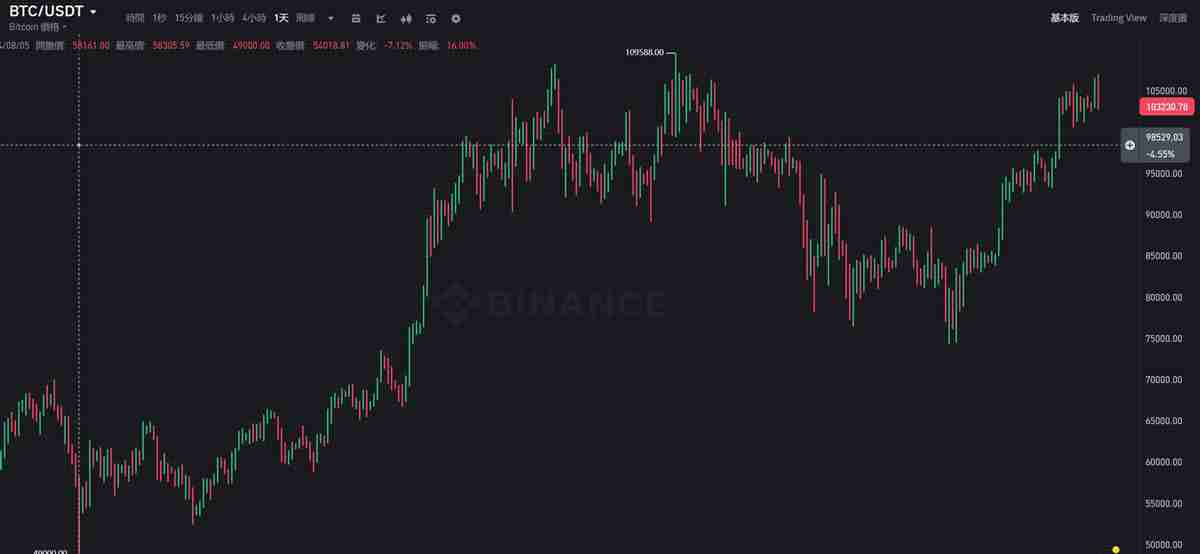
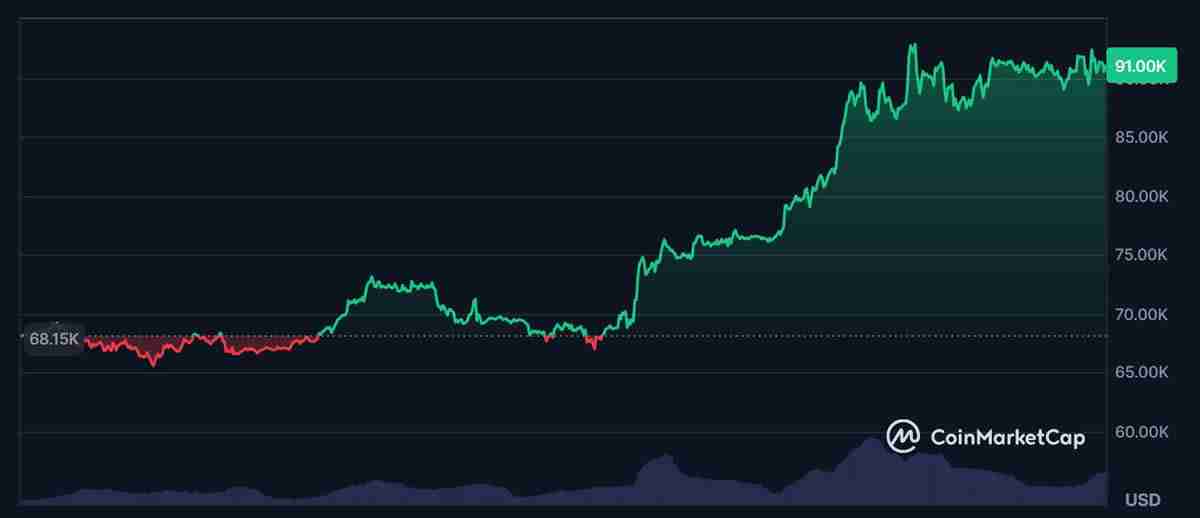
Each K-line usually appears as a red or green column, so it is also called a "K-bar". The following figure is an example of Bitcoin’s K-line on Binance platform, where red and green alternate lines represent price fluctuations over different time periods - each in this figure represents 4 hours.
By observing the K-line arrangement and pattern changes, we can judge that the current market is in an upward, downward or fluctuating stage.
The core component of the K-line
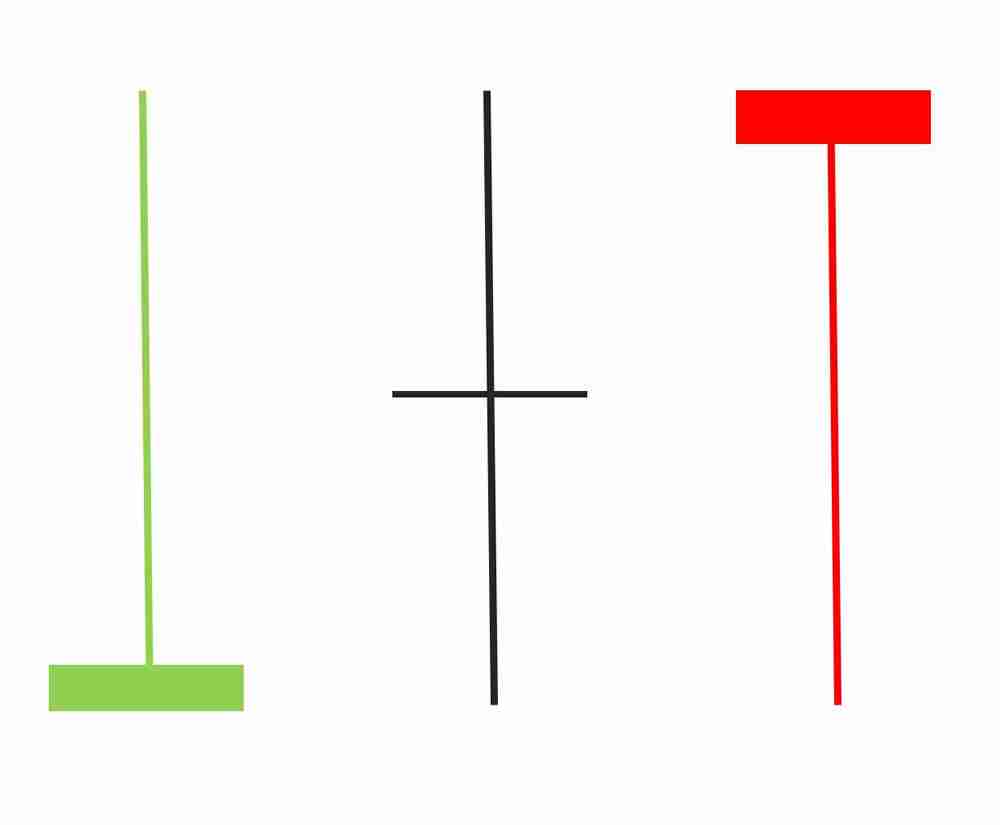
Each K-line consists of five elements:
- Opening price
- Close price
- The highest price in the current cycle
- The lowest price in the current cycle
- Rising and falling status (the closing price is higher than the opening price, and the other way around will fall)
The specific drawing logic is as follows:
- The physical part connects the opening and closing prices
- The upper and lower extension lines represent the highest point and lowest point in this period, respectively, called the upper shadow line and the lower shadow line.
- Default color settings: Green means rising, red means falling (color can be customized)
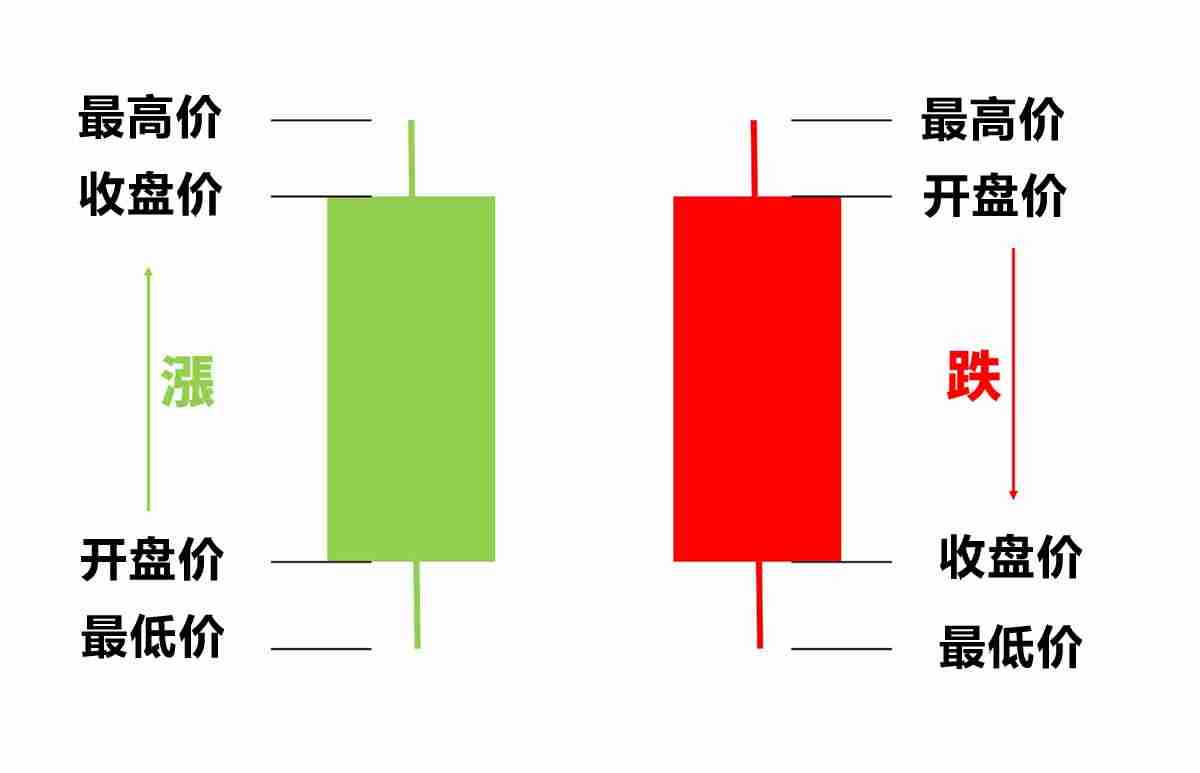
Because its appearance is similar to a candle, it is also called a candle chart:
- Candle body (physical) : reflects the price range from opening to closing
- Candle wick (hadow) : The upper shadow shows the highest price, the lower shadow shows the lowest price
- Color difference : Green = close>opening (up), red = close
For example:
- Green entity and no shadow, indicating that the bulls are strong and the price is rising steadily
- The red entity is obvious and has a long shadow line, which indicates that the short side is dominant but there is competition during the session, and eventually closes at the low level.
Time cycle and the uniqueness of the Bitcoin market:
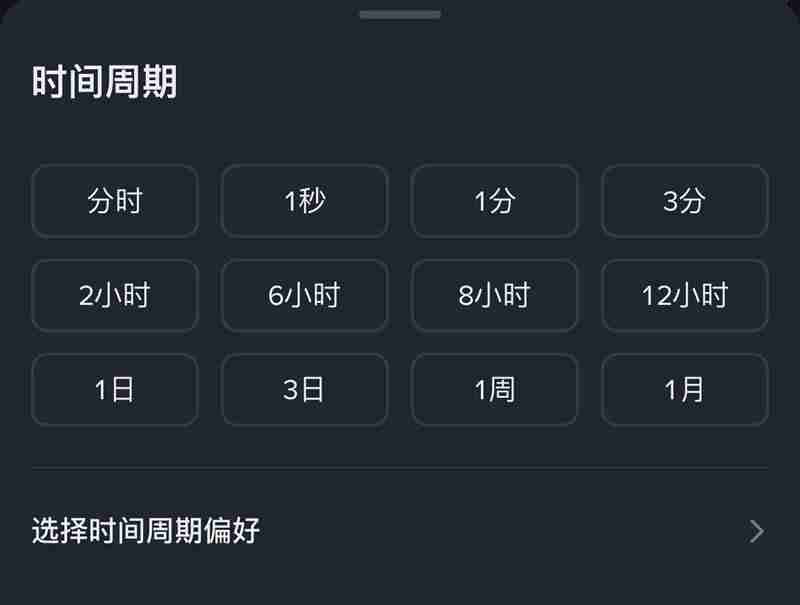
Different time units will generate different K-line charts, for example:
- A "1-hour K-line" records price fluctuations within 60 minutes
- A "Daily K" reflects the price trend of 24 hours a day
Unlike traditional stock markets that have a fixed opening and closing time, the cryptocurrency market operates around the clock. The system uses the price at the start of each cycle as the opening price and the price at the end of the cycle as the closing price. The time benchmark is usually set locally by UTC or exchange.
For example, the daily K-line automatically extracts four prices of the day every day to form a K-line; if a 4-hour K-line is used, 6 will be generated in a day; while the 15-minute K-line has 96 K-lines a day.
Longer periods such as weekly K and monthly K are also common. Medium- and long-term traders pay more attention to larger time frames such as 4-hour, daily, and weekly lines.
Advantages of K-line charts over ordinary price curves
The normal price chart only shows continuous changes in the closing price:
And the K-line chart can provide more dimensions of information:
Ordinary trend charts cannot reflect the volatility amplitude and the power comparison between buyers and sellers, and the K-line chart can not only see the direction, but also infer the long-short game status and judge market sentiment.
- Colors intuitively show rise and fall
- The length of the body length and short shadow line can help judge the fluctuation intensity and potential reversal signals
How to interpret a single K-line? Analysis of typical forms and practical signals
Beginners do not have to analyze all K-lines one by one. It is recommended to be familiar with several typical forms first and grasp the possible trend turning points.
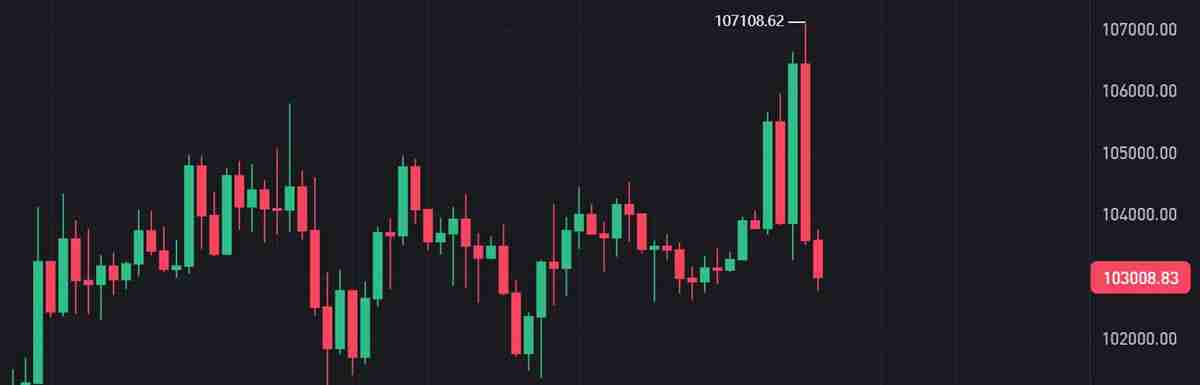
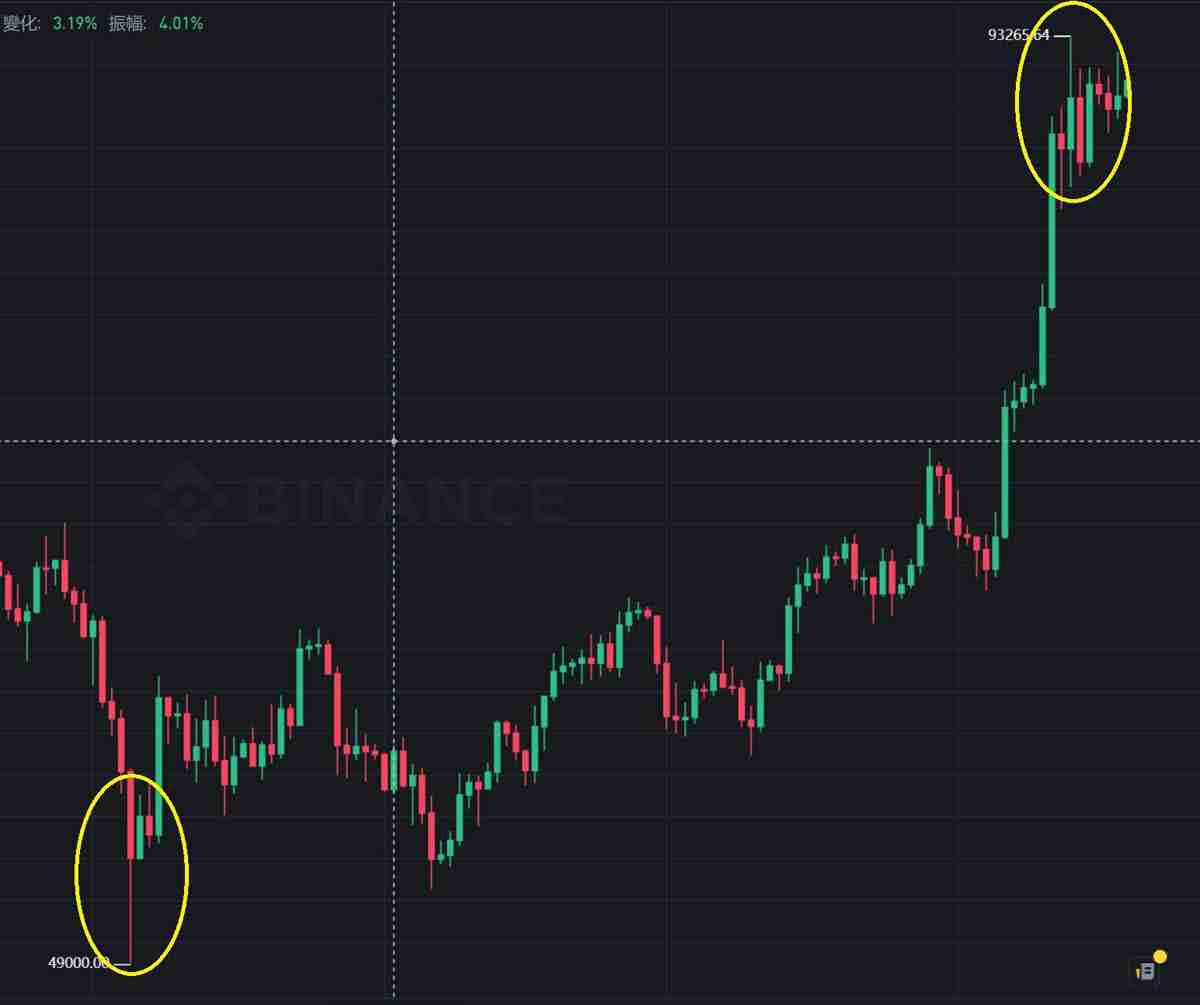
Large entity and short shadow K-line meaning (strong entry or kinetic energy failure)
This type of K-line has almost no upper and lower shadows, and the solid part is very long, looking like a pure red or pure green column. It is one of the easiest to identify and most valuable signals.
- The obvious green positive line: It indicates that the buyer has strong strength
- The obvious red big negative line: It means that selling pressure has an absolute advantage
However, it is necessary to judge its significance based on the location:
- A big positive/negative line breakout appears after consolidation : it may be a signal of the trend establishment (strong start)
- A large K-line appears again after a sharp rise or fall : it may mean that momentum is about to run out (end of the trend)
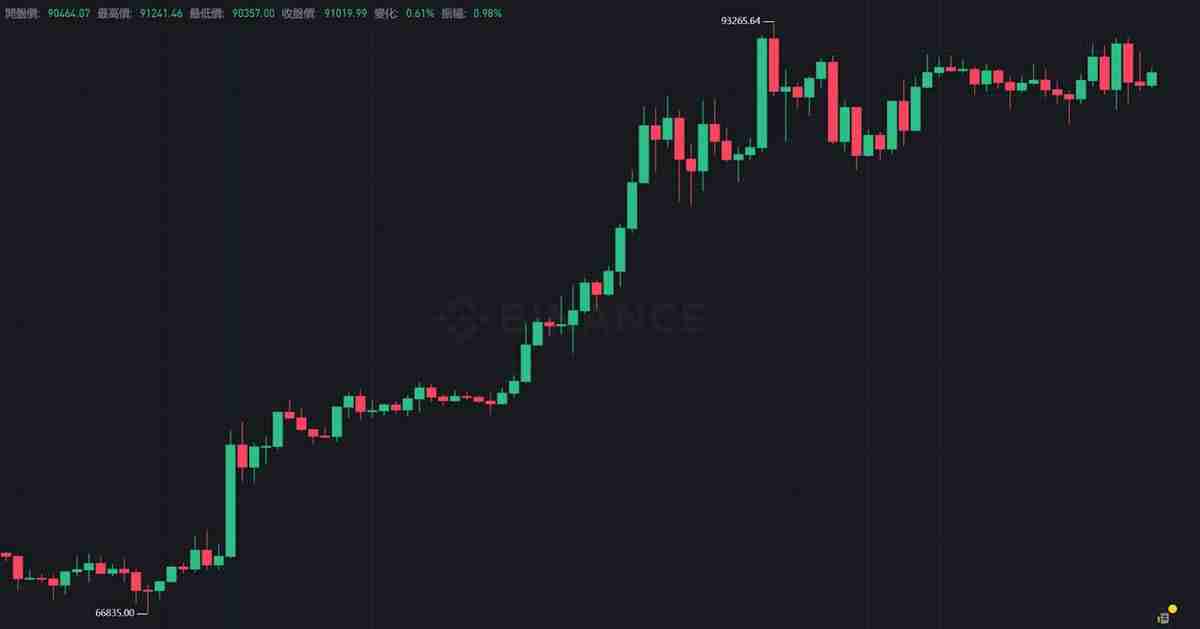
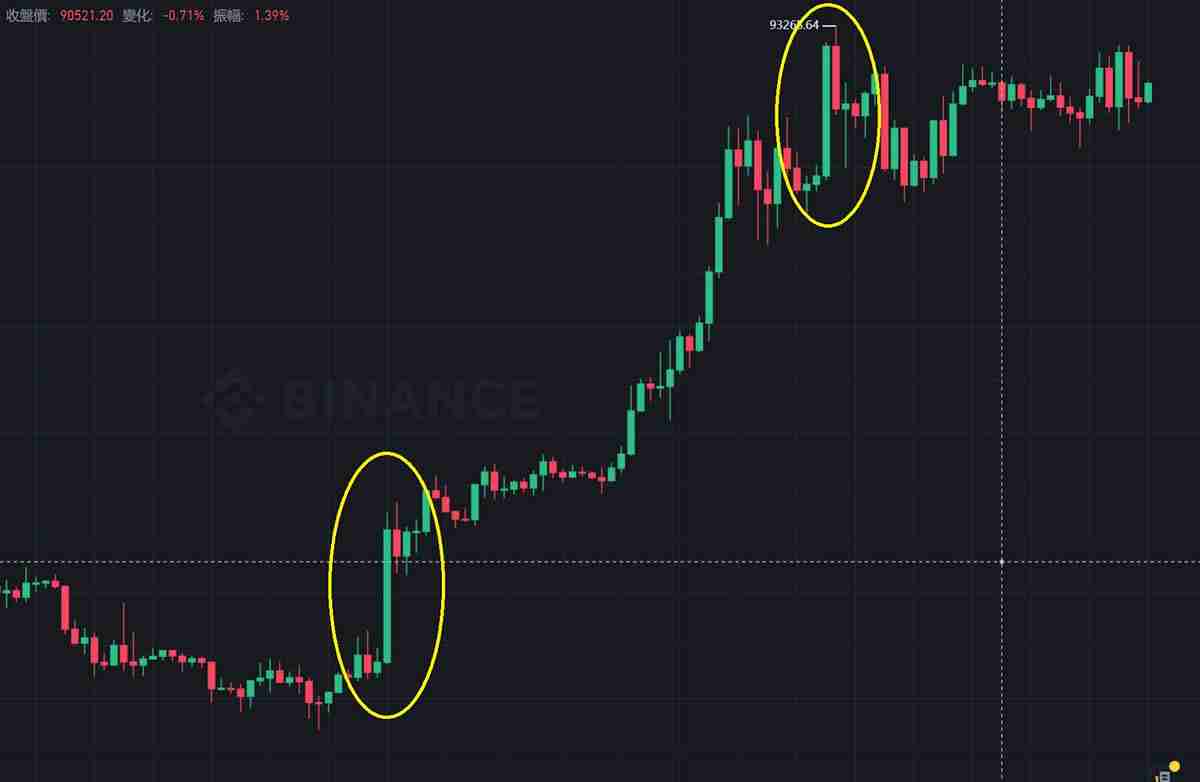
As shown in the figure below, the two big green Ks on the left and right appear in different positions, with completely different meanings.
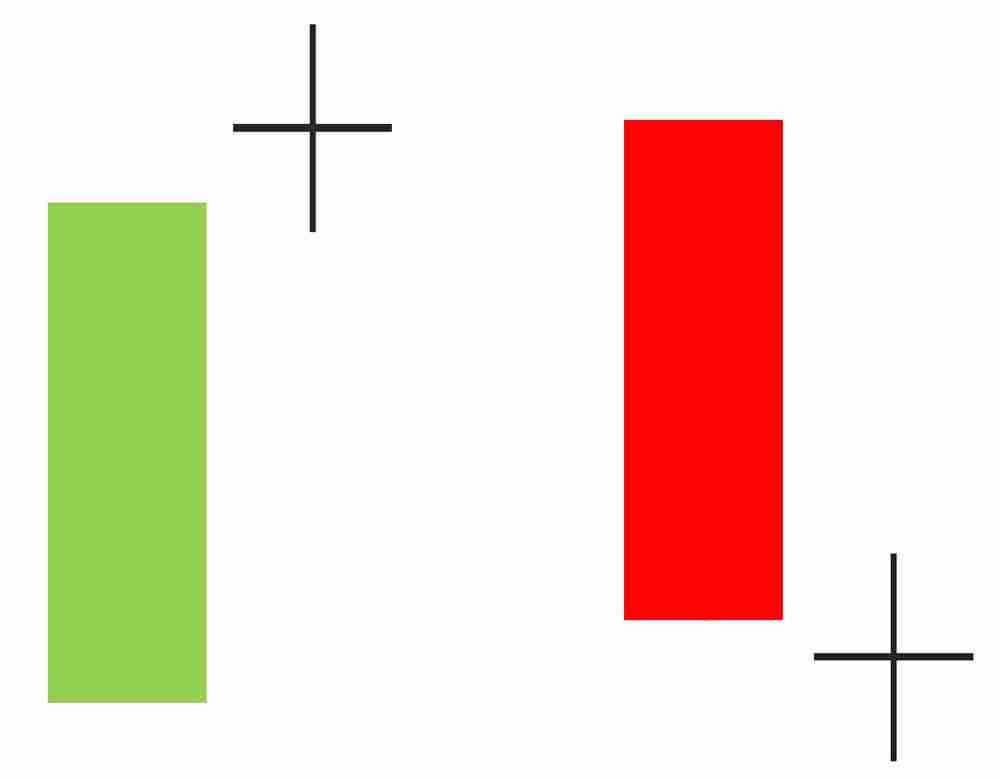
The meaning of long shadow line and small entity K-line (trend turning point or market hesitation)
This type of K-line entity is very short, but the upper and lower shadows are particularly long, and are often called "cross", "nail lines" or "pin".
This shows that the bulls and bears compete fiercely during this period, but in the end no one can win, and it often occurs before the trend turning point or during the oscillation period.
- If it occurs after a continuous rise or fall : it may be an early warning of a trend reversal
- If it appears in the sideways consolidation stage : it may be just that the market is waiting and watching, and no direction choice has been made yet
As shown in the figure below, a pattern similar to a "needle" can be seen near multiple highs and lows, reflecting the intensification of market hesitation.
Two forms appear one after another (the probability of changing the disk increases significantly)
If a large entity K-line appears first in the same area, followed by a long shadow K-line, it means that the long-short forces are changing rapidly. At this time, the market may change suddenly, so be vigilant.
Where to view the Bitcoin K-line chart?
If you want to practice observing the Bitcoin K-line trend, there are now many professional platforms to choose from. The following two tools are recommended for beginners and advanced users:
- Binance Exchange (Binance)
The world's largest cryptocurrency trading platform provides real-time market conditions and K-line charts of multiple time periods (such as 1 minute, 5 minutes, 1 hour, daily line, etc.), with a simple and easy-to-understand interface, suitable for operation while watching. - TradingView
The world's most popular technical analysis chart platform, supports custom indicators, line drawing tools, layer management and reminder functions. It is not only suitable for Bitcoin, but also for stocks, futures, foreign exchange and other assets, suitable for in-depth research.
How many minutes should I look at the K-line? Only by choosing the right time period can you grasp the trend direction
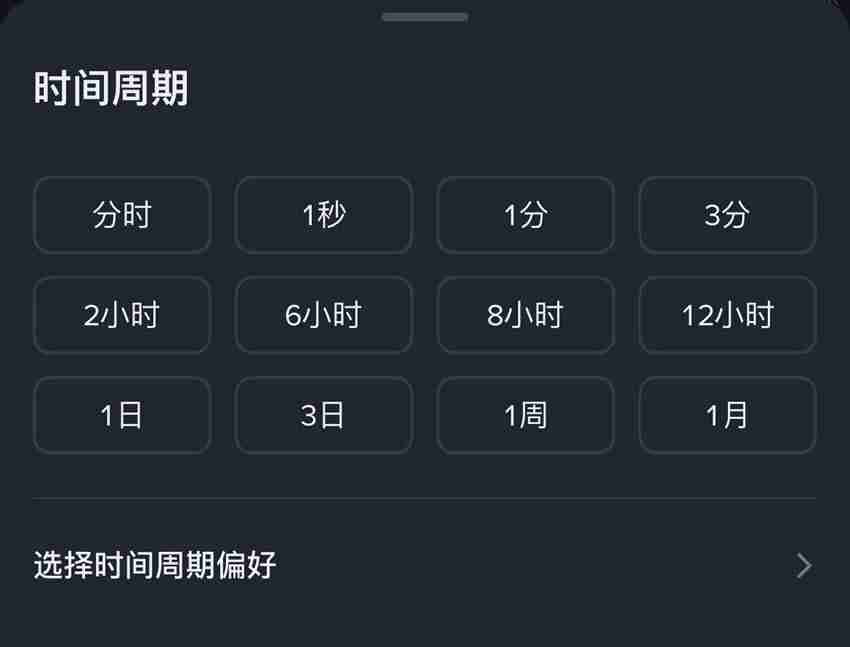
There are many K-line time units, which one should be used to make sense?
Different cycles are suitable for different types of traders. Correctly selecting the time frame helps accurately judge trends and timing of entry and exit.

Hot AI Tools

Undress AI Tool
Undress images for free

Undresser.AI Undress
AI-powered app for creating realistic nude photos

AI Clothes Remover
Online AI tool for removing clothes from photos.

Clothoff.io
AI clothes remover

Video Face Swap
Swap faces in any video effortlessly with our completely free AI face swap tool!

Hot Article
Hot Tools

Notepad++7.3.1
Easy-to-use and free code editor

SublimeText3 Chinese version
Chinese version, very easy to use

Zend Studio 13.0.1
Powerful PHP integrated development environment

Dreamweaver CS6
Visual web development tools

SublimeText3 Mac version
God-level code editing software (SublimeText3)


 What is Mango Network (MGO Coin)? MGO's future development and price forecast
Sep 02, 2025 pm 08:57 PM
What is Mango Network (MGO Coin)? MGO's future development and price forecast
Sep 02, 2025 pm 08:57 PM
Directory What is MangoNetwork (MGO Token)? Technical advantages (1) Excellent performance (2) Main features of safe and reliable MangoNetwork 1. Parallel execution architecture of multiple virtual machines 2. Advanced cross-chain communication 3. High-performance consensus mechanism 4. Enhanced security through the Move language 5. Modular blockchain design How MangoNetwork operates MGO token Economics Token allocation details: Unlocking and release timetable: MangoNetwork Roadmap and Future Development MangoNetwork Price Forecast MangoNetwork 20
 BNB Certification Service (BAS Coin) 2025–2030 Price Forecast: How much will the price reach in the future?
Sep 02, 2025 pm 07:00 PM
BNB Certification Service (BAS Coin) 2025–2030 Price Forecast: How much will the price reach in the future?
Sep 02, 2025 pm 07:00 PM
Table of Contents What is the latest news and updates of BAS coins? What is BAS coin introduced by the BNB certification service development team? BAS Token Economics BNB Certification Service (BAS) Price Forecast 2025–2030BNB Certification Service (BAS) Price Forecast Bollinger Bands and Momentum Indicators BNB Certification Service (BAS) Price Forecast 2025–2030BNB Certification Service (BAS) Price Forecast 2026 Price Forecast BNB Certification Service (BAS) Price Forecast
 What is Cronos (CRO coin)? Is it a good investment? Future price forecast of CRO coin
Sep 02, 2025 pm 08:51 PM
What is Cronos (CRO coin)? Is it a good investment? Future price forecast of CRO coin
Sep 02, 2025 pm 08:51 PM
Contents What is Cronos (CRO) How many CROCRO coins are there Main functions CRO and Solana Comparison of the technical team behind CRO and the origins Important news and events Is CRO a good investment CRO long-term price forecast CRO2025 price forecast CRO2026-2031 price forecast CRO2031-2036 price forecast FAQ Cronos (CRO) is a native token of the Cronos ecosystem, and the project is well known for its position at the intersection of Ethereum and Cosmos blockchains. As a basis
 How to authenticate the Ouyi Exchange account? OKX Identity Authentication Newbie Guide 2025
Sep 02, 2025 pm 09:00 PM
How to authenticate the Ouyi Exchange account? OKX Identity Authentication Newbie Guide 2025
Sep 02, 2025 pm 09:00 PM
Why real-name authentication compliance requirements At present, global supervision of the financial field is becoming increasingly strict, especially in terms of capital flow. In order to comply with relevant regulations on international anti-money laundering (AML) and anti-terrorism financing (CFT), real-name authentication has become a necessary part of compliance operations. Through identity verification, the OKX platform can ensure that its services comply with the legal frameworks of various countries, especially with a legitimate basis when handling cross-border transactions. Ensure transaction security Real-name authentication can effectively prevent identity impersonation and fraud and improve the security of the transaction process. By verifying the user's true identity, the system can identify and prevent illegal funds from flowing in or out, thereby effectively protecting users' digital assets from infringement. Improve service quality After confirming the user's identity, the platform can provide more accurate service support.
 HYPE trading volume crushes the giant, and is actually the 'most underrated dark horse' in the L1 public chain? One article analysis
Sep 02, 2025 pm 09:03 PM
HYPE trading volume crushes the giant, and is actually the 'most underrated dark horse' in the L1 public chain? One article analysis
Sep 02, 2025 pm 09:03 PM
1. Hyperliquid trading volume "sky": spot perpetual double-line overtakes Recently, the trading activity of the decentralized exchange Hyperliquid has ushered in explosive growth, and its market performance has posed a significant challenge to traditional centralized platforms. Spot trading volume jumped: On August 24, Hyperliquid attracted market attention due to a large-scale asset conversion transaction - an unknown address deposited about 22,100 BTC and exchanged positions to 555,000 ETH, with a transaction volume of more than US$2.4 billion. This move directly pushed its BTC spot trading volume to the second largest in the world on the day, with a market share of 12%, second only to Binance's 38%. Compared with the previous average daily share of about 1%, the growth is extremely significant. Perpetual contracts continue to lead: Hyper
 How much should WLFI, the most core token of the Trump family, be launched tomorrow?
Sep 02, 2025 pm 08:18 PM
How much should WLFI, the most core token of the Trump family, be launched tomorrow?
Sep 02, 2025 pm 08:18 PM
Table of Contents The designer behind WLFI WLFI Tokens valuation geometry Which big players bought Aqua1FundDWFLabsMikeDudasTroyMurraySigilFund (pseudonymFiskantes) On August 26, the Trump family crypto project WLFI issued a statement announcing that the Lockbox page will be launched, and holders can move the tokens into it and prepare to start the unlocking process. On September 1, at 8 a.m. ET, WLFI will complete its first release—the initial allocation of 20% of the tokens will be officially added.
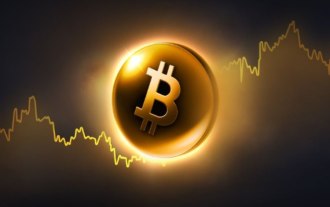 How is Bitcoin's recent performance? Review of Bitcoin's 10-year price and future trend analysis
Sep 02, 2025 pm 08:30 PM
How is Bitcoin's recent performance? Review of Bitcoin's 10-year price and future trend analysis
Sep 02, 2025 pm 08:30 PM
Table of Contents Recent Bitcoin Price Performance Recent Price Volatility Causes Analysis of Macroeconomic Factors Regulatory Policy Dynamics Technical Factors Market Sentiment and Investor Behavior Bitcoin 10 Years Price Review Future Trend Forecast Investor Reference Strategy Summary Bitcoin (BTC) As one of the most influential crypto assets in the world, its price fluctuations have always attracted much attention. According to the latest data, the real-time price of Bitcoin is $112,954, with trading volume reaching $64,081,589,151 in the past 24 hours, an increase of 1.74%. Bitcoin market capitalization is approximately US$2,249,221,777,686, circulating and supplying
 What is Reploy (RAI Coin)? RAI future outlook and price forecast
Sep 02, 2025 pm 08:39 PM
What is Reploy (RAI Coin)? RAI future outlook and price forecast
Sep 02, 2025 pm 08:39 PM
Directory What is Reploy? Reploy’s main highlights: Reploy’s reasons why Reploy stands out recently Reploy Overview How Reploy works? How Reploy Editor Helps Developers Write Optimized Code How ReployLLM Provides Advantages to Web3 Developers How Reploy's AI Agent Automate Blockchain Tasks Possible Token Uses Financing Details Reploy's Token Economics Is Reploy worth buying? Risks that rising potential need to be weighed Reploy Price Forecast Reploy 2025 Price Forecast Reploy