


Detailed explanation of Firefox Developer Tools (DevTools): A powerful tool to improve website performance
This article will explore in-depth Firefox Developer Tools (DevTools), a set of tools designed to help developers check, debug, analyze and optimize the performance of websites and web applications. We will focus on performance-related tools, and introduce the introduction to how to use DevTools and some practical settings.
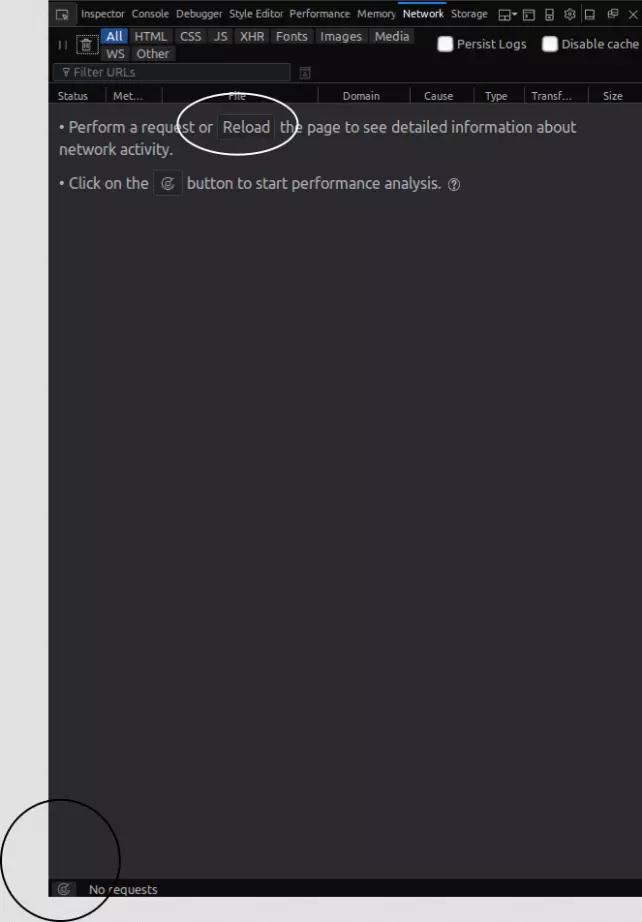
How to access DevTools:
Firefox DevTools has many options to help developers customize their experience, such as enabling timestamps in the web console, or disabling HTTP caching (used to simulate the first load performance of all pages that open DevTools).
How to access the DevTools settings panel:
First open DevTools, then:

Here, you can select the default tool, the buttons to display in the toolbox, the theme (dark-light-Firebug), and other advanced settings.
When analyzing the performance of a web application, it is necessary to distinguish between load time performance and runtime performance.
Loading time performance answers questions like "What resources are loading too long?" When dealing with runtime performance, we need to focus on JavaScript and CSS (especially CSS animations) in order to see where the code spends most of its time and what causes the bottleneck.
Let's take a look at network monitors and performance tools.

Network Monitor displays all network requests made by Firefox in a tabular form (e.g., loading a page or sending XMLHttpRequests, Fetch API requests, etc.).
It can also display HTTP headers, HTTP responses, and cookies related to the request and allow you to search for them. You can also use it to perform, display, and save performance analysis for the current page load.
In short, this tool can be used to determine the time it takes for a browser to download different resources of a web page.
You can also use this tool to monitor and locate requests that cause slow or blocked web pages to load. The network panel shows when the main event (DOMContentLoaded and load) is triggered.
Each request in the network list contains a timeline column that displays timing information related to the request, such as the total time when the resource is loaded.
DevTools marks major lifecycle events in reports, such as DOMContentLoaded and page loading. Blue indicates the time when the DOMContentLoaded event was triggered; purple indicates the time when the page load event was triggered.

DOMContentLoaded event fires when HTML documents are fully loaded and parsed, excluding CSS stylesheets, images, and frameworks.
load event fires when the HTML document and all its associated stylesheets, images, and frames are fully loaded.
After clicking on the request list, you can see a right-double details pane with many different tabs such as headers, parameters, responses, timing, and security.
For performance, we will pay special attention to timing information.
In this pane, there are many timing metrics related to each request:
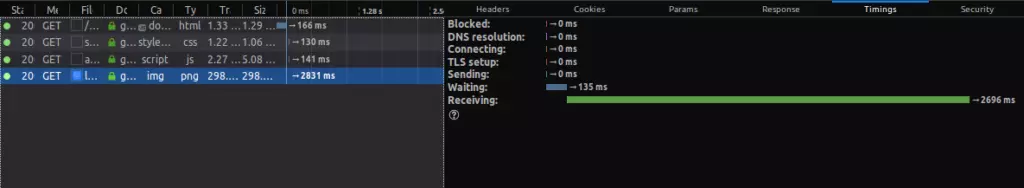
Blocked is the time spent waiting for a network connection to be in the queue.
Sending is the time it takes to send a request to the server.
Receiving is the time it takes to receive a response from the server, or (if cached) it takes to read it from the cache.
Waiting is the total time the client waits before receiving the first byte. In other performance analysis tools such as WebPageTest.org or Chrome's DevTools, this is called TTFB or the first byte time.
There is also DNS resolution, which is the time it takes to resolve the server hostname, and Connecting, which is the time it takes to open a TCP connection.
Network Monitor integrates a performance analysis tool that can be used to analyze the load time performance of web pages.
To start analyzing load time performance, you can:
The final report shows pie charts and corresponding tables for resources received by type: JavaScript, CSS, images and fonts, etc., as well as a summary containing the following details:

Web pages are tested with empty caches and filled caches.
Firefox's DevTools allows you to analyze the performance of your web application in two different situations:
You can also use the Disable Cache setting to simulate the first loading of a web page when DevTools is opened on any tab.
JavaScript is single threaded, which means that the browser runs code synchronously, but thanks to HTML5 Web Workers (the standard API for multi-threaded JavaScript), you can run code in other threads as well.
This single thread is responsible for running all the work the browser is doing, such as layout rendering, compute styles, and garbage collection.
In addition, events such as setTimeout, click and load, as well as resource acquisition, are executed by a single thread. (Indeed, these tasks are executed asynchronously, but the asynchrony in JavaScript is different: it is simulated by using event-driven methods, event loops, and queues.)
Good performance and responsiveness are attributed to the asynchronous model of JavaScript, but long-running functions can lead to poor performance and poor UI responsiveness.
Performance tools allow you to discover bottlenecks and performance issues on web pages by providing insights into web page UI responsiveness (responsive to user interactions) and JavaScript code performance.
Using the Performance Tool, you can control the Start and Stop Recording buttons to start performing performance analysis of the currently opened web page for a period of time that you can control. The tool then displays a summary and a table and graphical view of the actions the browser performs to render the page.
You can use performance tools to find and detect long-running code snippets that block single threads.
The steps to using performance tools are very simple:
Be sure to follow some user interaction scenarios and interact with different parts of the application UI during the analysis, especially the parts you want to optimize. Also avoid unnecessary extra operations: For example, don't interact with parts you don't try to analyze, as they only add more noise to the reported results.
Firefox's DevTools supports selecting or narrowing the time frame of configuration files. You can click on the timeline or FPS chart section and drag the mouse to select a period of time. After stopping dragging, DevTools will update other views and charts to display only the event information that occurred during that time period.
Frame rate chart displays the number of frames per second during recording. When recording runs, this chart acts as an FPS meter with real-time values.
FPS chart displays the FPS maximum, minimum and average FPS values for the analysis time. All of these values can quickly tell you if there are any performance bottlenecks.
If you are running any animations, the FPS should be 60 fps. Watch this video to see why this value is so important:
You can use this chart to quickly discover visual gaps (crash) and inconsistencies that indicate severe frame rate drops (indicating a performance bottleneck in the browser).
You can see the FPS chart with crashes from this screenshot:

Wikipedia interprets the waterfall diagram as:
A form of data visualization helps to understand the cumulative effects of positive or negative values introduced in sequence. Because of the obvious suspension of the bar chart (bricks) in the air, the waterfall chart is also called a flying brick chart or a Mario chart.

Picture source
In the case of performance tools, the waterfall diagram shows a breakdown of the activities the browser is performing and browser-specific events, such as:
Layout operations or rearrangements and style calculations are expensive, so these may be potential areas of optimization. Please refer to this Google article for more details.
The following is a screenshot of the waterfall diagram of the sample application:

Calling the tree view shows JavaScript functions on which the browser spends most of its time, as well as important metrics such as the total time of activity, its own time and its percentage relative to the total analysis time.

Owned time refers to the time spent by the operation only, regardless of the function it calls.
Total time refers to the time spent on operations and the functions they call.
The call tree tells you statistically what functions (aggregation) the browser spends most of its time during recording.
Flame graph displays the flame graph of the JavaScript call stack during analysis. Flame diagram is a performance visualization type created by Brendan Gregg.

Flame maps enable fast and accurate identification of most hotspot code paths.
Stacked bar charts mean that the top operation that exists directly in the CPU calls the bottom operation.
You can read more about the flame diagram here.
You can use frame rate and JavaScript flame graphs, waterfall graphs, and call tree views to find out the performance issues and find out the specific functions that need to be optimized.
The flame graph shows the state of the call stack for a specific function at a specific point in time recorded.
The flame graph contains a lot of data, so to get a meaningful reading, you need to zoom in until you select a few milliseconds.
Different charts and sections use the same colors to color-code the same type of operations and assets - JavaScript, CSS, rendering, drawing, etc.
You can use colors to distinguish operations in different views, quickly discover the types of operations that are causing problems, and track the types of operations when switching between different view angles.

You can filter out the individual activities you want to see in charts and views through this menu, where you can also see different colors associated with different actions.
For example, if you use CSS animations, you need to focus on activities such as recalculating styles, applying style changes, layouts, and drawing. You can filter out other activities to reduce noise.
For JavaScript, you need to focus on function calls, parsing HTML, and parsing XML.
In this article, we have learned how to get started with Firefox's DevTools and how to use different performance-related sub-tools. Firefox's DevTools is very comprehensive, and with Firefox's recent performance upgrades, it is more able to accurately identify the real problem areas during website rendering. We encourage you to explore further on your own after you become familiar with the terminology and know what to look for.
Performance audits in Firefox developer tools are designed to help developers understand the performance of their web applications in real time. It provides insights into various performance metrics such as load time, rendering speed, and JavaScript execution. By analyzing these metrics, developers can identify bottlenecks, optimize code, and improve overall user experience.
To access performance tools in Firefox Developer Edition, you need to open the Developer Tools panel. You can do this by right-clicking anywhere on the web page and selecting Check Elements. Then, click the Performance tab. Here you can start a new recording to analyze the performance of your web application.
Firefox Developer Edition is a Firefox version designed specifically for web developers. It contains a range of tools and features not found in a regular Firefox browser, such as advanced performance auditing tools, CSS grids, and JavaScript debuggers. These tools can help developers build, test and debug their web applications more efficiently.
Firefox's PageSpeed Insights add-on provides an easy way to analyze web page performance. Once the add-on is installed, you can access it from the Firefox toolbar. Simply enter the URL of the page you want to analyze and the add-on will provide a detailed report on its performance, including suggestions for improvement.
Firefox's Archi FPS Meter add-on is a tool that allows you to measure the frame rate of web applications. This is very useful for identifying performance issues, especially in web-based games or animations. The add-on displays the current frame rate in the Firefox toolbar, allowing you to monitor performance in real time.
Firefox's All-in-One PageSpeed Test add-on provides a comprehensive analysis of web page performance. After installing the add-on, you can access it from the Firefox toolbar. Enter the URL of the page you want to analyze and the add-on will provide detailed reports including loading time, PageSpeed scores, and improvement suggestions.
Firefox Developer Tools provide multiple ways to improve the performance of your web application. You can use the Performance tab to identify bottlenecks in your code, the Network tab to analyze load times, and the JavaScript debugger to optimize scripts. Additionally, the PageSpeed Insights add-on can provide specific suggestions for improvement.
Yes, Firefox developer tools include responsive design patterns that allow you to simulate different screen sizes and resolutions. This is very useful for analyzing the performance of mobile web applications and ensuring they provide a good user experience on all devices.
Common performance issues that can be identified with Firefox developer tools include slow loading time, low rendering efficiency, and excessive JavaScript execution. These problems can lead to poor user experience, so it is important to identify and resolve these issues early in the development process.
There are many resources to help you learn more about using Firefox developer tools for performance audits. The Mozilla Developer Network provides comprehensive documentation on all aspects of the tool, including detailed guides and tutorials. In addition, there are many online communities and forums where you can ask questions and share your experiences with other developers.
The above is the detailed content of Performance Auditing: A Firefox Developer Tools Deep Dive. For more information, please follow other related articles on the PHP Chinese website!


![[Web front-end] Node.js quick start](https://img.php.cn/upload/course/000/000/067/662b5d34ba7c0227.png)


