As a developer, mastering debugging techniques within integrated development environments (IDEs) is crucial for efficient and effective Java application development. Let's explore what IDEs are, why you should adeptly debug Java applications using them, and the step-by-step process to accomplish this.

IDEs, or Integrated Development Environments, are software suites that combine tools necessary for software development into a single graphical user interface. Common features include a code editor, debugger, compiler, and project management tools.
Popular IDEs for Java development include:
These IDEs not only help write and compile code but also provide extensive debugging tools, simplifying the process of identifying and resolving issues in your code.
Debugging is vital for producing reliable and efficient code. Here are a few reasons why mastering debugging within IDEs is beneficial:
Here’s a practical step-by-step guide on how to debug Java applications using an IDE, specifically IntelliJ IDEA, which is widely regarded for its robust debugging capabilities.
First, ensure your Java project is correctly set up in the IDE:

Write your Java code, ensuring you have a somewhat complex example that would benefit from debugging. Here’s a simple example:
public class Main {
    public static void main(String[] args) {
        int result = addNumbers(5, 3);
        System.out.println("Result: " + result);
    }

    public static int addNumbers(int a, int b) {
        int sum = a + b;
        return sum;
    }
}

Breakpoints are crucial for inspecting the code flow:

To start debugging:

When execution is paused, you can inspect variables and the application state:

Control execution using step commands:

Evaluate complex expressions:

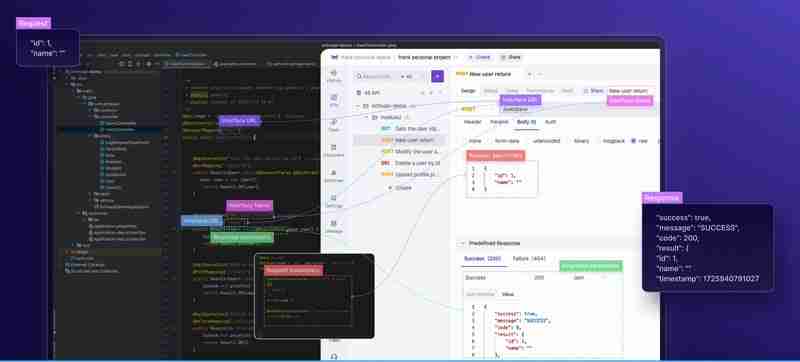
Now that you understand how to debug Java applications using IntelliJ IDEA, let me introduce you to a fantastic tool that can further enhance your development experience: EchoAPI for IntelliJ IDEA.

EchoAPI for IntelliJ IDEA is not just another plugin; it’s designed to streamline and elevate your Java development workflow. Imagine having the ability to generate comprehensive API documentation, test APIs instantly, and synchronize your data—all with a few clicks. Let's dive into some of the standout features EchoAPI offers:
With EchoAPI, you can effortlessly create detailed and comprehensive API documentation tailored specifically to your code. This frees you to focus more on coding, while the plugin handles the creation of clear and concise documents, aiding quick understanding and navigation.

EchoAPI significantly boosts productivity by allowing you to test your APIs in real-time with just one click. This feature provides instant responses, helping you identify and fix issues on the fly, thus saving you precious development time.

Creating and debugging custom APIs has never been easier. EchoAPI lets you craft APIs to meet specific needs and ensures their performance through easy, one-click testing, making your development process smooth and efficient.
Backing up your data securely is a breeze with EchoAPI’s One-Click Sync. This feature ensures that your data is safely stored in the EchoAPI Client, offering you peace of mind with up-to-date backups.
Handling diverse data types and customizing parameter parsing to suit various API scenarios is made simple with EchoAPI. This flexibility ensures your APIs can accommodate a wide range of requests effortlessly.
EchoAPI boasts a compact and efficient design, providing a responsive user experience without the bloat of unnecessary software. This minimalistic approach keeps the focus on coding and debugging, maintaining an agile development environment.

These features collectively enhance both the development and debugging processes, making EchoAPI for IntelliJ IDEA an indispensable tool for serious developers. By integrating EchoAPI into your workflow, you not only streamline your tasks but also elevate the overall efficiency and productivity of your coding endeavors.
Mastering debugging in IDEs is essential for any Java developer. It enhances efficiency, helps visualize complex code flows, and integrates seamlessly with other development tools, making it easier to identify and resolve issues. IntelliJ IDEA, with its powerful debugging capabilities, stands out as a premier choice for Java development.
Additionally, the EchoAPI for IntelliJ IDEA plugin further elevates the development experience by offering comprehensive API documentation, instantaneous debugging, custom API creation, secure data backup, flexible parameter parsing, and an efficient, lightweight design.
By combining the robust debugging tools of IntelliJ IDEA with the enhanced functionalities of EchoAPI, developers can achieve a more streamlined, productive, and efficient workflow. Happy coding and debugging!
The above is the detailed content of How to Debug Java Applications Using IDEs. For more information, please follow other related articles on the PHP Chinese website!
 What does java routing mean?
 What to do if there is no sound from the computer microphone
 What is the difference between php and java
 What does root server mean?
 js string to array
 How to buy, sell and trade Bitcoin
 Can Douyin sparks be lit again if they have been off for more than three days?
 What is the difference between USB-C and TYPE-C


