Perhaps one of the biggest difficulties for those starting to study Machine Learning is working, processing the data, making small inferences, and then putting together your model.
In this article I will exemplify how to analyze a dataset to better build a Machine Learning model by going through:
But let's start from the beginning, so we can contextualize, what is Machine Learning (ML)?
ML is one of the different branches of Artificial Intelligence (AI), as well as Neural Networks or Robotics, and others. The type of machine learning depends on how the data is structured, so it can be divided into different types, from there creating a model. An ML model is created using algorithms that process input data and learn to predict or classify the results.
To create an ML model we need a dataset, within the dataset there must be our input features, which is basically our entire dataset except for the target column depending on our type of learning, if it is Supervised learning the dataset must contain the targets, or labels, or correct answers, as this information will be used for training and testing the model.
Some types of learning and the dataset structure for them:
Therefore, the dataset basically defines the entire behavior and learning process of the model generated by the machine.
To continue with the examples, I will use a dataset with labels, exemplifying a model with Supervised Learning, where the objective will be to define the monthly value of life insurance for a specific audience.
Let's start by loading our dataset and see its first lines.
import pandas as pd

data = pd.read_csv('../dataset_seguro_vida.csv')
data.head()

Let's detail our data a little more, we can see its format, and discover the number of rows and columns in the dataset.
data.shape

We have here a data structure of 500 rows and 9 columns.
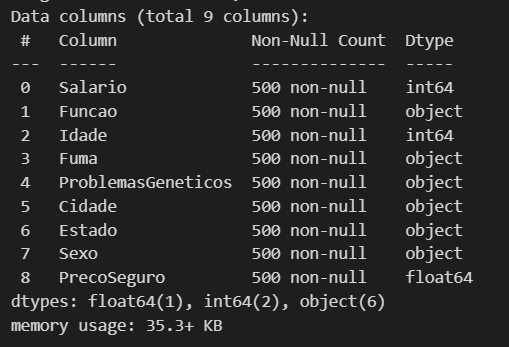
Now let's see what types of data we have and if we are missing any data.
data.info()

We have 3 numeric columns here, including 2 int (whole numbers) and 1 float (numbers with decimal places), and the other 6 are object. So we can move on to the next step of processing the data a little.
A good step towards improving our dataset is to understand that some types of data are processed and even understood more easily by the model than others. For example, data that is of type object is heavier and even limited to work with, so it is better to transform it to category, as this allows us to have several gains from performance to efficiency in memory use (in In the end, we can even improve this by making another transformation, but when the time comes I'll explain better).
object_columns = data.select_dtypes(include='object').columns

for col in object_columns:
    data[col] = data[col].astype('category')

data.dtypes

Como o nosso objetivo é conseguir estipular o valor da mensalidade de um seguro de vida, vamos dar uma olhada melhor nas nossas variáveis numéricas usando a transposição.
data.describe().T

Podemos aqui ver alguns detalhes e valores dos nossos inputs numéricos, como a média aritmética, o valor mínimo e máximo. Através desses dados podemos fazer a separação desses valores em grupos baseados em algum input de categoria, por gênero, se fuma ou não, entre outros, como demonstração vamos fazer a separação por sexo, para visualizar a media aritmética das colunas divididas por sexo.
value_based_on_sex = data.groupby("Sexo").mean("PrecoSeguro")
value_based_on_sex

Como podemos ver que no nosso dataset os homens acabam pagando um preço maior de seguro (lembrando que esse dataset é fictício).
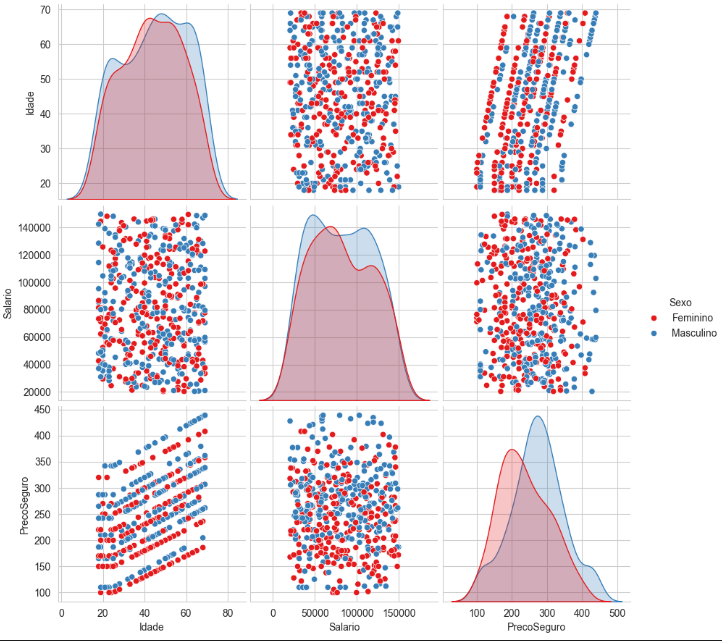
Podemos ter uma melhor visualização dos dados através do seaborn, é uma biblioteca construída com base no matplotlib usada especificamente para plotar gráficos estatísticos.
import seaborn as sns

sns.set_style("whitegrid")

sns.pairplot(
    data[["Idade", "Salario", "PrecoSeguro", "Sexo"]],
    hue = "Sexo",
    height = 3,
    palette = "Set1")

Aqui podemos visualizar a distribuição desses valores através dos gráficos ficando mais claro a separação do conjunto, com base no grupo que escolhemos, como um teste você pode tentar fazer um agrupamento diferente e ver como os gráficos vão ficar.
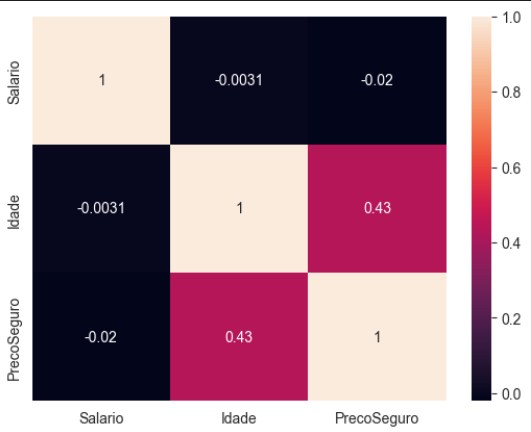
Vamos criar uma matriz de correlação, sendo essa uma outra forma de visualizar a relação das variáveis numéricas do dataset, com o auxilio visual de um heatmap.
numeric_data = data.select_dtypes(include=['float64', 'int64'])

corr_matrix = numeric_data.corr()
sns.heatmap(corr_matrix, annot= True)

Essa matriz transposta nos mostra quais variáveis numéricas influenciam mais no nosso modelo, é um pouco intuitivo quando você olha para a imagem, podemos observar que a idade é a que mais vai interferir no preço do seguro.
Basicamente essa matriz funciona assim:
Os valores variam entre -1 e 1:
1: Correlação perfeita positiva - Quando uma variável aumenta, a outra também aumenta proporcionalmente.
0: Nenhuma correlação - Não há relação linear entre as variáveis.
-1: Correlação perfeita negativa - Quando uma variável aumenta, a outra diminui proporcionalmente.
Lembra da transformada que fizemos de object para category nos dados, agora vem a outra melhoria comentada, com os dados que viraram category faremos mais uma transformada, dessa vez a ideia é transformar essa variáveis categóricas em representações numéricas, isso nos permitirá ter um ganho incrível com o desempenho do modelo já que ele entende muito melhor essas variáveis numéricas.
Conseguimos fazer isso facilmente com a lib do pandas, o que ele faz é criar nova colunas binarias para valores distintos, o pandas é uma biblioteca voltada principalmente para analise de dados e estrutura de dados, então ela já possui diversas funcionalidades que nos auxiliam nos processo de tratamento do dataset.
data = pd.get_dummies(data)

Pronto agora temos nossas novas colunas para as categorias.
Para a construção do melhor modelo, devemos saber qual o algoritmo ideal para o propósito da ML, na tabela seguinte vou deixar um resumo simplificado de como analisar seu problema e fazer a melhor escolha.

Olhando a tabela podemos ver que o problema que temos que resolver é o de regressão. Aqui vai mais uma dica, sempre comesse simples e vá incrementando seu e fazendo os ajustes necessários até os valores de previsibilidade do modelo ser satisfatório.
Para o nosso exemplo vamos montar um modelo de Regressão Linear, já que temos uma linearidade entre os nossos inputs e temos como target uma variável numérica.
Sabemos que a nossa variável target é a coluna PrecoSeguro , as outras são nossos inputs. Os inputs em estatísticas são chamadas de variável independente e o target de variável dependente, pelos nomes fica claro que a ideia é que o nosso target é uma variável que depende dos nosso inputs, se os inputs variam nosso target tem que vai variar também.
Vamos definir nosso y com o target
y = data["PrecoSeguro"]
E para x vamos remover a coluna target e inserir todas as outras
X = data.drop("PrecoSeguro", axis = 1)
Antes de montarmos o modelo, nosso dataset precisa ser dividido uma parte para teste e outra para o treino, para fazer isso vamos usar do scikit-learn o método train_test_split.
from sklearn.model_selection import train_test_split

X_train,X_test,y_train,y_test=train_test_split(
    X,y,
    train_size = 0.80,
    random_state = 1)
Aqui dividimos o nosso dataset em 80% para treino e 20% para testes. Agora podemos montar o nosso modelo.
from sklearn.linear_model import LinearRegression

lr = LinearRegression()

lr.fit(X_train,y_train)
Modelo montado agora podemos avaliar seu desempenho
lr.score(X_test, y_test).
lr.score(X_train, y_train)
Aqui podemos analisar a o coeficiente de determinação do nosso modelo para testes e para o treinamento.
Podemos usar um outro método para poder descobrir o desvio padrão do nosso modelo, e entender a estabilidade e a confiabilidade do desempenho do modelo para a amostra
<p>from sklearn.metrics import mean_squared_error<br>
import math</p>

<p>y_pred = lr.predict(X_test)<br>
math.sqrt(mean_squared_error(y_test, y_pred))</p>
O valor perfeito do coeficiente de determinação é 1, quanto mais próximo desse valor, teoricamente melhor seria o nosso modelo, mas um ponto de atenção é basicamente impossível você conseguir um modelo perfeito, até mesmo algo acima de 0.95 é de se desconfiar.
Se você tiver trabalhando com dados reais e conseguir um valor desse é bom analisar o seu modelo, testar outras abordagens e até mesmo revisar seu dataset, pois seu modelo pode estar sofrendo um overfitting e por isso apresenta esse resultado quase que perfeitos.
Aqui como montamos um dataset com valores irreais e sem nenhum embasamento é normal termos esses valores quase que perfeitos.
Deixarei aqui um link para o github do código e dataset usados nesse post
The above is the detailed content of Dataset when building a Machine Learning model. For more information, please follow other related articles on the PHP Chinese website!


