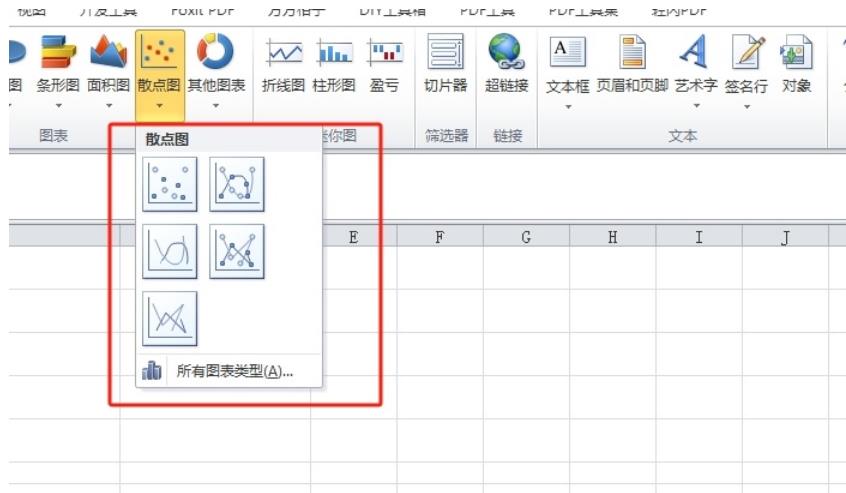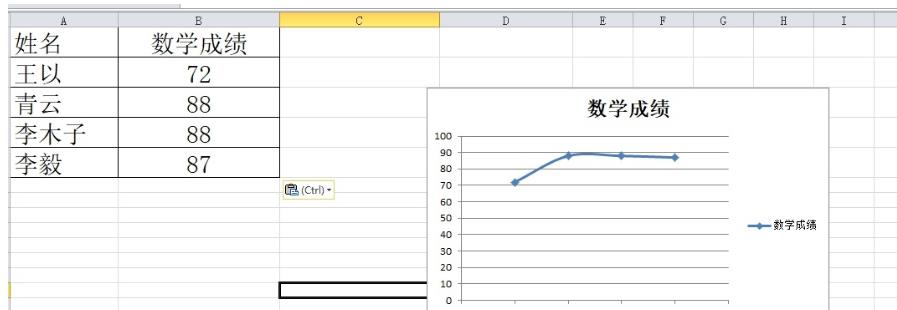
Excel tables can help us easily complete data entry, so how can Excel draw a graph with two columns of data as the xy axis? Users can directly select two columns of data, and then directly click the insert option under the toolbar to explore. Let this site give users a detailed introduction to the tutorial on how to make an xy chart from two columns of data in Excel. Tutorial on how to make an xy graph from two columns of data in excel 1. The user opens the excel software on the computer and comes to the editing page of the table file to select two columns of data.


The above is the detailed content of How to draw a graph in excel using two columns of data as the xy axis respectively. Tutorial on how to make an xy graph using two columns of data in excel.. For more information, please follow other related articles on the PHP Chinese website!


