
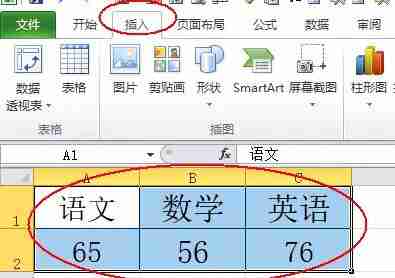
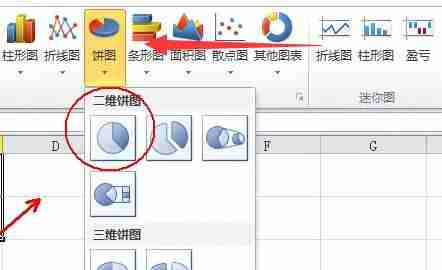
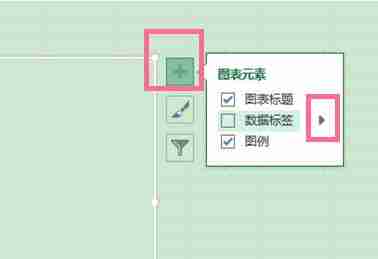
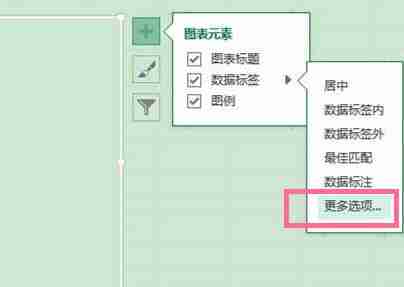
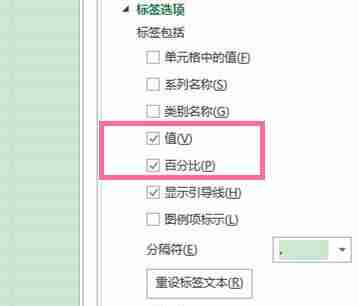
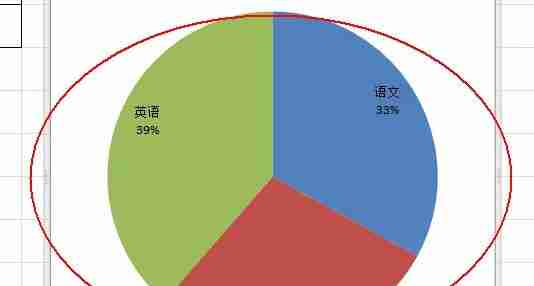
How to convert data into a chart to display percentages in excel? Many of us record various data through tables, but when it comes to comparison, it is more obvious in the form of percentages. Therefore, many users want to convert it into a pie chart to display percentages, but they don't know how to do it. , it doesn’t matter, today the editor of PHP Chinese website will share with you the specific operation methods. I hope that the content of this software tutorial can be helpful to everyone. Method for converting excel data into a chart displaying percentages: 1. First, we select the data to be converted and enter Insert
The above is the detailed content of How to convert data into chart showing percentage in excel. For more information, please follow other related articles on the PHP Chinese website!


