


If you want to monitor your in-game performance stats but don’t know which tool to use, fret not. Here are three in-game performance monitoring apps I wholeheartedly recommend to every PC gamer, regardless of which hardware you're using.
The NVIDIA Statistics Overlay is part of GeForce Experience and the new NVIDIA app, meaning you probably already have access to it if you own an NVIDIA graphics card. I like this one because it’s fairly simple to set up and use. While it lacks some important performance monitoring stats, such as a frame-time graph, it’s a solid choice for PC gamers who just want the basics. Perhaps the biggest disadvantage of this tool is that, naturally, it isn’t available to owners of AMD GPUs.
The NVIDIA Statistics Overlay includes an impressive suite of latency-related performance stats that include render latency (the time needed for your graphics card to fully render a single frame), mouse latency, combined PC and display latency (the time from when your OS registers your mouse click to when a frame is rendered of your monitor), and total system latency.
Setting up the overlay is pretty straightforward. Note that the following guide is for the NVIDIA app, but the procedure is quite similar if you’ve got GeForce Experience installed on your PC instead.
You can pull up the overlay when in-game by pressing Alt+R while GeForce Experience or the NVIDIA app runs in the background. To set up and tweak the overlay, press Alt+Z to open the NVIDIA overlay and then select the “Statistics” tab located at the bottom of the NVIDIA in-game overlay.

Once there, make sure to select the “Custom” statistics view, click on the "View All" button, and then simply enable the performance metrics you want to see on the statistics overlay.

You can also configure the heads-up display by clicking the "Configure Heads Up Display" button in the "Statistics" options menu.
 RivaTuner Statistics Server
The legendary RivaTuner Statistics Server, also known as RTSS, is the oldest in-game performance monitoring tool on this list. I’ve been using RTSS for more than a decade, and in that time, I’ve had zero issues with it.
I like it because it has an impressive suite of performance metrics you can monitor and because it’s fairly simple to use after you learn how to configure it. On the other hand, RTSS requires a third-party app to pull the performance data from. Since RTSS is bundled with MSI Afterburner, I recommend using that combo because MSI Afterburner can provide most of the GPU and CPU-related stats you’d want to monitor.
But if you want to also monitor advanced CPU stats such as per-core clocks, RAM sticks, and SSD thermals or include other exotic stats such as your motherboard chipset thermals, voltage of different PSU rails, and much more, you’ll need to install and configure HWiNFO64.
I recommend downloading and installing the MSI Afterburner and RTSS combo. Download and configure HWiNFO only if you want access to advanced stats not found in MSI Afterburner.
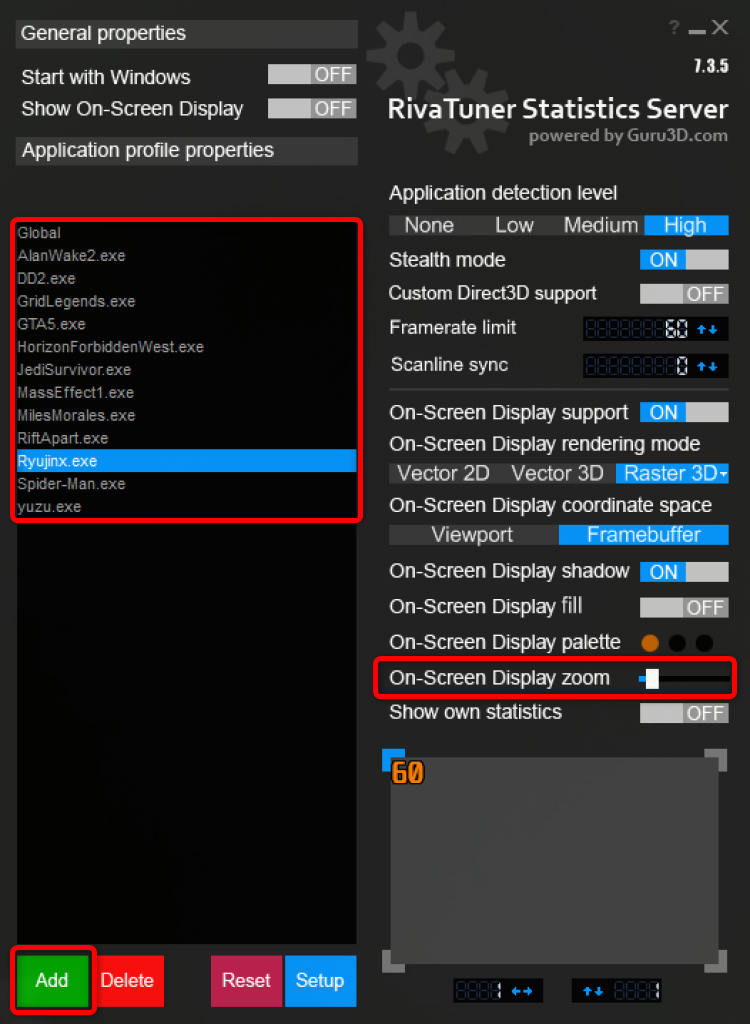
After you download and install both apps, open RTSS, which you can find in the taskbar notification area. You might have to click the “Show Hidden Icons” button to access the RTSS and MSI Afterburner icons. Once you open RTSS, set the “On Screen Display Support” to ON.

Don't forget that you can add game EXE files to RTSS and create custom RTSS profiles. For example, if a game uses anti-cheat that can block RTSS, I recommend creating a custom profile and disabling the on-screen display (OSD) only in that game. You can also tweak a couple more OSD-related options in RTSS, such as the OSD zoom level.
You can also use RTSS as an in-game frame limiter, which I recommend because I’ve found it works much better than frame limiters available in games or those available in NVIDIA and AMD apps.
設定完 RTSS 相關選項後,開啟 MSI Afterburner,找到設定圖標,然後按一下它。進入選項選單後,找到「螢幕顯示」標籤並指定用於顯示和隱藏螢幕顯示的鍵,如下所示。您也可以指派一個鍵來切換 OSD,但就我而言,無論我指派哪個鍵,OSD 切換都不起作用。

現在,按一下「監控」標籤。在此標籤中,您可以選擇想要在 OSD 上看到的任何遊戲內效能指標;若要啟用它,請按一下「在螢幕顯示中顯示」方塊。您也可以透過點擊「覆蓋圖表名稱」和「覆蓋群組名稱」按鈕來重新命名每個指標。

啟用您想要在 OSD 上看到的效能統計資料後,按一下「套用」按鈕,然後進入遊戲並按您對應的開啟按鈕來嘗試 OSD RTSS 效能疊加。
此清單中的第三個也是最後一個條目是 Intel PresentMon。我已經使用 PresentMon 幾個月了,可以說它運作良好,並為大多數 PC 遊戲玩家(包括高級用戶)提供了足夠的效能監控指標。與 RTSS 相比,PresentMon 可能是更好的解決方案,因為它不需要第三方軟體來提取效能指標。
雖然 RTSS 仍然是我的最愛,但我向所有尋求不需要額外軟體的一體化解決方案的 PC 遊戲玩家以及找到 NVIDIA 統計數據覆蓋的 NVIDIA GPU 用戶推薦 PresentMon不足。
雖然PresentMon 在多個方面都勝過NVIDIA 統計覆蓋範圍和RTSS,但與此列表中的其他兩個遊戲內效能監控工具相比,它的主要優勢是它支援GPU 和CPU 繁忙指標,這非常好。
簡而言之,這些統計數據顯示 GPU 或 CPU 繁忙的時間百分比。對於 GPU 密集型工作負載(例如視訊遊戲),您希望 GPU 100% 的時間都處於繁忙狀態,因為這意味著您的 GPU 不會閒置等待來自 CPU 的資料。觀看下面由 Gamers Nexus 提供的深入解釋視頻,以了解有關 GPU 和 CPU 繁忙指標的更多資訊。
設定 Intel PresentMon 相當簡單。首先,下載並安裝軟體。
接下來,打開應用程式。從那裡,您可以選擇一種監控預設或建立自訂預設。您也可以透過點擊「設定」按鈕自訂常規設置,例如疊加層的位置和大小。

選擇自訂預設後,按一下「編輯」按鈕進行自訂。

進入配置選單後,探索不同的選項並建立完美的監控覆蓋。

您可以透過按下「加號」按鈕組合多個指標。例如,您可以將 GPU 和 CPU 繁忙圖與 GPU 和 CPU 等待圖、平均和 99% 低 FPS、CPU 和 GPU 利用率等結合。 「加號」按鈕旁的「選項」按鈕可讓您自訂每個圖表。

不要忘記,您可以將大多數數據顯示為讀數(換句話說,數字)或圖表。
我希望本指南能幫助您找到下一個遊戲內效能監控工具。想要了解更多關於遊戲內效能指標以及您應該關注哪些統計數據的資訊?了解我個人監控的遊戲內表現統計數據以及原因。
The above is the detailed content of 3 In-Game Performance Monitoring Tools I Recommend to Every PC Gamer. For more information, please follow other related articles on the PHP Chinese website!


![[Web front-end] Node.js quick start](https://img.php.cn/upload/course/000/000/067/662b5d34ba7c0227.png)


