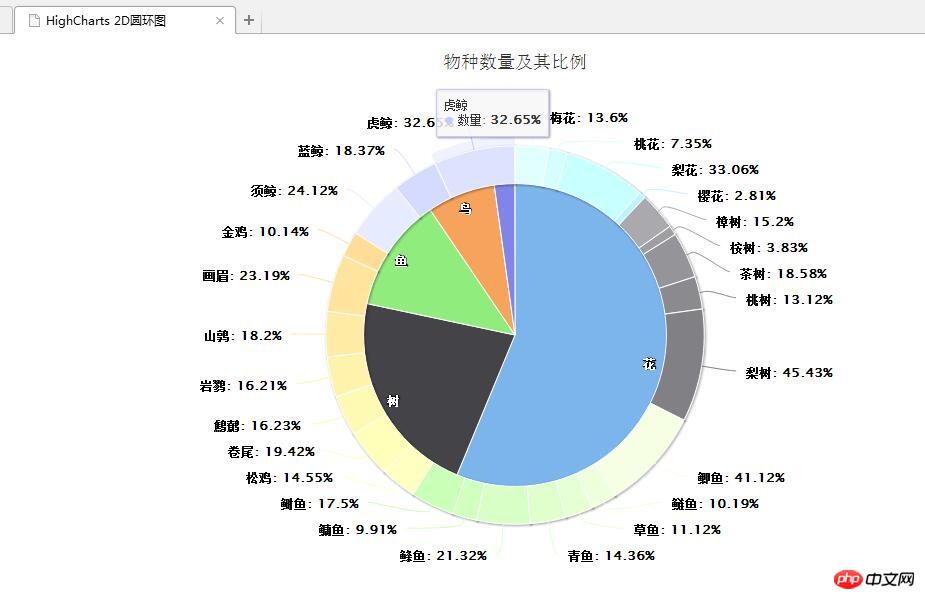
In diesem Artikel wird hauptsächlich die Wirkung des jQuery-Plug-Ins HighCharts zum Zeichnen eines 2D-Donut-Diagramms vorgestellt. Er analysiert die Implementierungsschritte und zugehörigen Betriebstechniken von jQuery mithilfe des HighCharts-Plug-Ins zum Zeichnen eines Donut-Diagramms in Form von Beispielen. Es enthält auch einen Demo-Quellcode, den Leser als Referenz herunterladen können. Sie können darauf verweisen, ich hoffe, es kann allen helfen.
Das Beispiel in diesem Artikel beschreibt den Effekt des Zeichnens eines 2D-Donut-Diagramms mit dem jQuery-Plug-in HighCharts. Teilen Sie es wie folgt mit allen:
1. Beispielcode:
<!DOCTYPE html>
<html>
<head>
<meta charset="UTF-8">
<title>HighCharts 2D圆环图</title>
<script type="text/javascript" src="js/jquery-1.7.2.min.js"></script>
<script type="text/javascript" src="js/highcharts.js"></script>
<script type="text/javascript">
$(function(){
var colors = Highcharts.getOptions().colors,
categories = ['花', '树', '鱼', '鸟', '鲸'],
name = 'Browser brands',
data = [{
y: 55.11,
color: colors[0],
drilldown: {
name: '花的种类',
categories: ['梅花', '桃花', '梨花', '樱花'],
data: [13.6, 7.35, 33.06, 2.81],
color: colors[0]
}
}, {
y: 21.63,
color: colors[1],
drilldown: {
name: '树的种类',
categories: ['樟树', '桉树', '茶树', '桃树', '梨树'],
data: [15.20, 3.83, 18.58, 13.12, 45.43],
color: colors[1]
}
}, {
y: 11.94,
color: colors[2],
drilldown: {
name: '鱼的种类',
categories: ['鲫鱼', '鲢鱼', '草鱼', '青鱼', '鲦鱼','鳙鱼', '鲥鱼'],
data: [41.12, 10.19, 11.12, 14.36, 21.32, 9.91, 17.50],
color: colors[2]
}
}, {
y: 7.15,
color: colors[3],
drilldown: {
name: '鸟的种类',
categories: ['松鸡', '卷尾', '鹪鹩', '岩鹨', '山鹑','画眉', '金鸡'],
data: [14.55, 19.42, 16.23, 16.21, 18.20, 23.19, 10.14],
color: colors[3]
}
}, {
y: 2.14,
color: colors[4],
drilldown: {
name: '鲸的种类',
categories: ['须鲸', '蓝鲸', '虎鲸'],
data: [ 24.12, 18.37, 32.65],
color: colors[4]
}
}];
// 构建物种数据
var speciesData = [];
var speData = [];
for (var i = 0; i < data.length; i++) {
// 添加物种数据
speciesData.push({
name: categories[i],
y: data[i].y,
color: data[i].color
});
for (var j = 0; j < data[i].drilldown.data.length; j++) {
var brightness = 0.4 - (j / data[i].drilldown.data.length) / 5 ;
speData.push({
name: data[i].drilldown.categories[j],
y: data[i].drilldown.data[j],
color: Highcharts.Color(data[i].color).brighten(brightness).get()
});
}
}
// 创建圆环图
$('#donutChart').highcharts({
chart: {
type: 'pie'
},
title: {
text: '物种数量及其比例'
},
yAxis: {
title: {
text: '比例'
}
},
plotOptions: {
pie: {
shadow: true,
center: ['50%', '50%']
}
},
tooltip: {
valueSuffix: '%'
},
series: [{
name: '物种',
data: speciesData,
size: '70%',
dataLabels: {
formatter: function() {
return this.y > 5 ? this.point.name : null;
},
color: 'white',
distance: -30
}
}, {
name: '数量',
data: speData,
size: '80%',
innerSize: '80%',
dataLabels: {
formatter: function() {
return this.y > 1 ? '<b>'+ this.point.name +':</b> '+ this.y +'%' : null;
}
}
}]
});
});
</script>
</head>
<body>
<p id="donutChart" style="width: 1250px; height: 550px; margin: 0 auto"></p>
</body>
</html>2 >
 Verwandte Empfehlungen:
Das obige ist der detaillierte Inhalt vonTeilen von HighCharts-Zeichnungsbeispielen für 2D-Donut-Diagrammeffekte. Für weitere Informationen folgen Sie bitte anderen verwandten Artikeln auf der PHP chinesischen Website!
 Was sind Primzahlen?
 Was ist Javaweb?
 So wechseln Sie auf dem Laptop in den abgesicherten Modus
 So überprüfen Sie den Videospeicher von Win11
 Was ist ein UI-Designer?
 Windows kann nicht auf den freigegebenen Computer zugreifen
 So verwenden Sie Split in Python
 Welche Daten speichert der Redis-Cache im Allgemeinen?


