


It's hard to argue Atlassian JIRA is one of the most popular issue trackers and project management solutions. You can love it, you can hate it, but if you were hired as a software engineer for some company, there is a high probability of meeting JIRA.
If the project you are working on is very active, there can be thousands of JIRA issues of various types. If you are leading a team of engineers, you can be interested in analytical tools that can help you understand what is going on in the project based on data stored in JIRA. JIRA has some reporting facilities integrated, as well as 3rd party plugins. But most of them are pretty basic. For example, it's hard to find rather flexible "forecasting" tools.
The bigger the project, the less satisfied you are with integrated reporting tools. At some point, you will end up using an API to extract, manipulate, and visualize the data. During the last 15 years of JIRA usage, I saw dozens of such scripts and services in various programming languages around this domain.
Many day-to-day tasks may require one-time data analysis, so writing services every time doesn't pay off. You can treat JIRA as a data source and use a typical data analytics tool belt. For example, you may take Jupyter, fetch the list of recent bugs in the project, prepare a list of "features" (attributes valuable for analysis), utilize pandas to calculate the statistics, and try to forecast trends using scikit-learn. In this article, I would like to explain how to do it.
Here, we will talk about the cloud version of JIRA. But if you are using a self-hosted version, the main concepts are almost the same.
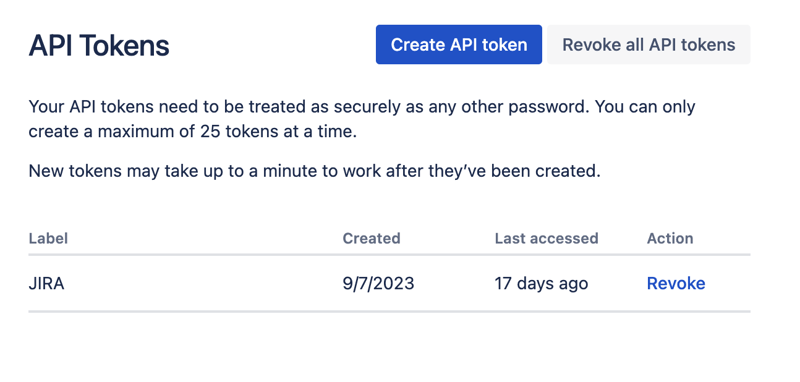
First of all, we need to create a secret key to access JIRA via REST API. To do so, go to profile management - https://id.atlassian.com/manage-profile/profile-and-visibility If you select the "Security" tab, you will find the "Create and manage API tokens" link:
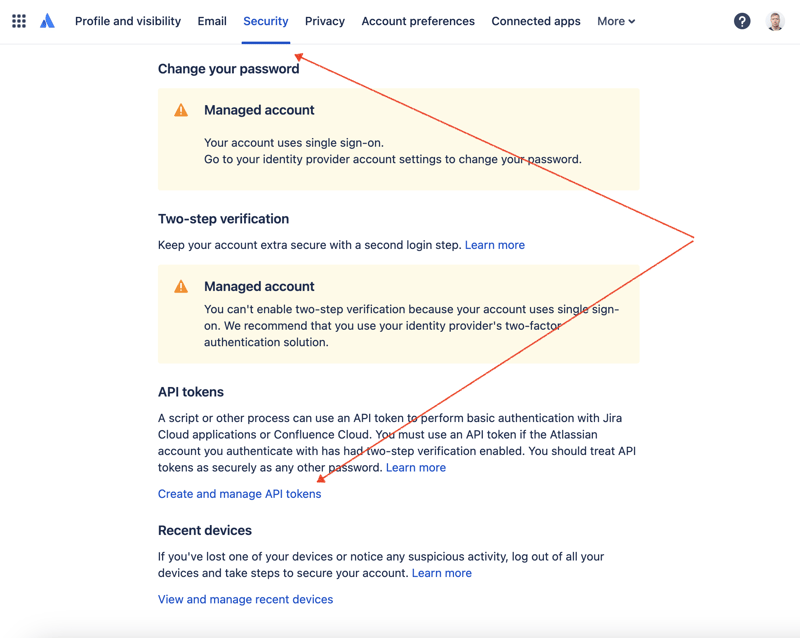
Create a new API token here and store it securely. We will use this token later.
One of the most convenient ways to play with datasets is to utilize Jupyter. If you are not familiar with this tool, do not worry. I will show how to use it to solve our problem. For local experiments, I like to use DataSpell by JetBrains, but there are services available online and for free. One of the most well-known services among data scientists is Kaggle. However, their notebooks don't allow you to make external connections to access JIRA via API. Another very popular service is Colab by Google. It allows you to make remote connections and install additional Python modules.
JIRA has a pretty easy-to-use REST API. You can make API calls using your favorite way of doing HTTP requests and parse the response manually. However, we will utilize an excellent and very popular jira module for that purpose.
Let's combine all the parts to come up with the solution.
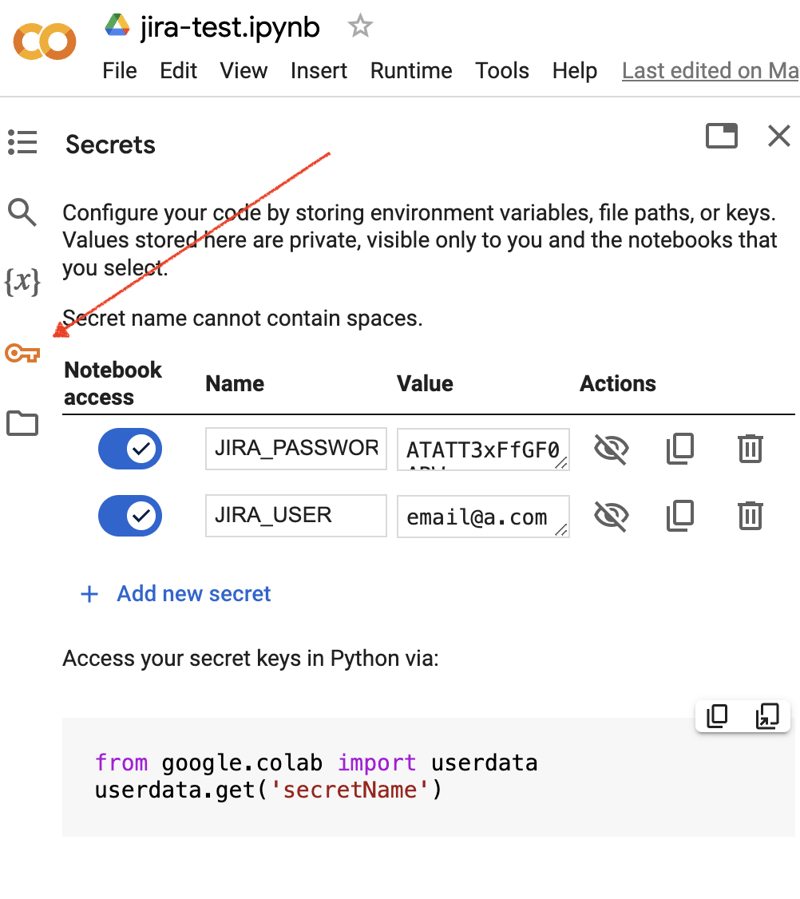
Go to the Google Colab interface and create a new notebook. After the notebook creation, we need to store previously obtained JIRA credentials as "secrets." Click the "Key" icon in the left toolbar to open the appropriate dialog and add two "secrets" with the following names: JIRA_USER and JIRA_PASSWORD. At the bottom of the screen, you can see the way how to access these "secrets":
The next thing is to install an additional Python module for JIRA integration. We can do it by executing the shell command in the scope of the notebook cell:
!pip install jira
The output should look something like the following:
Collecting jira Downloading jira-3.8.0-py3-none-any.whl (77 kB) ━━━━━━━━━━━━━━━━━━━━━━━━━━━━━━━━━━━━━━━━ 77.5/77.5 kB 1.3 MB/s eta 0:00:00 Requirement already satisfied: defusedxml in /usr/local/lib/python3.10/dist-packages (from jira) (0.7.1) ... Installing collected packages: requests-toolbelt, jira Successfully installed jira-3.8.0 requests-toolbelt-1.0.0
We need to fetch the "secrets"/credentials:
from google.colab import userdata JIRA_URL = 'https://******.atlassian.net' JIRA_USER = userdata.get('JIRA_USER') JIRA_PASSWORD = userdata.get('JIRA_PASSWORD')
And validate the connection to the JIRA Cloud:
from jira import JIRA jira = JIRA(JIRA_URL, basic_auth=(JIRA_USER, JIRA_PASSWORD)) projects = jira.projects() projects
If the connection is ok and the credentials are valid, you should see a non-empty list of your projects:
[, , , ...
So we can connect and fetch data from JIRA. The next step is to fetch some data for analysis with pandas. Let’s try to fetch the list of solved problems during the last several weeks for some project:
JIRA_FILTER = 19762 issues = jira.search_issues( f'filter={JIRA_FILTER}', maxResults=False, fields='summary,issuetype,assignee,reporter,aggregatetimespent', )
We need to transform the dataset into the pandas data frame:
import pandas as pd df = pd.DataFrame([{ 'key': issue.key, 'assignee': issue.fields.assignee and issue.fields.assignee.displayName or issue.fields.reporter.displayName, 'time': issue.fields.aggregatetimespent, 'summary': issue.fields.summary, } for issue in issues]) df.set_index('key', inplace=True) df
The output may look like the following:
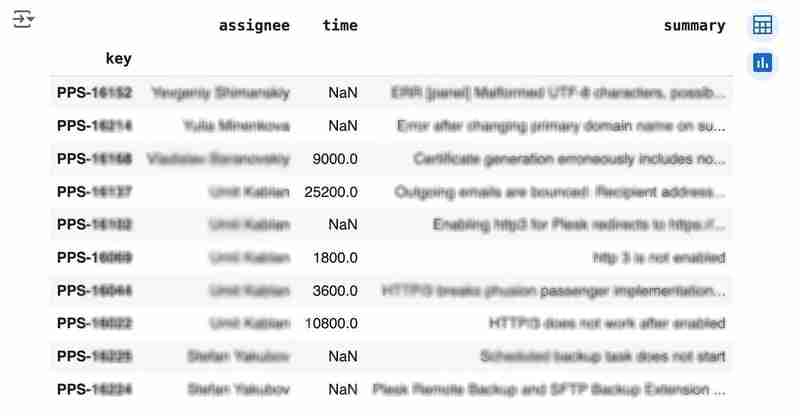
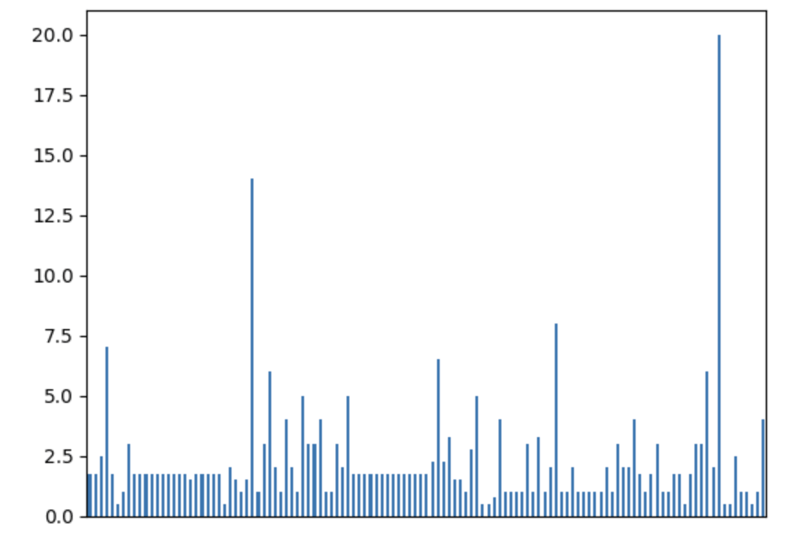
We would like to analyze how much time it usually takes to solve the issue. People are not ideal, so sometimes they forget to log the work. It brings a headache if you try to analyze such data using JIRA built-in tools. But it's not a problem for us to make some adjustments using pandas. For example, we can transform the "time" field from seconds into hours and replace the absent values with the median value (beware, dropna can be more suitable if there are a lot of gaps):
df['time'].fillna(df['time'].median(), inplace=True) df['time'] = df['time'] / 3600
We can easily visualize the distribution to find out anomalies:
df['time'].plot.bar(xlabel='', xticks=[])
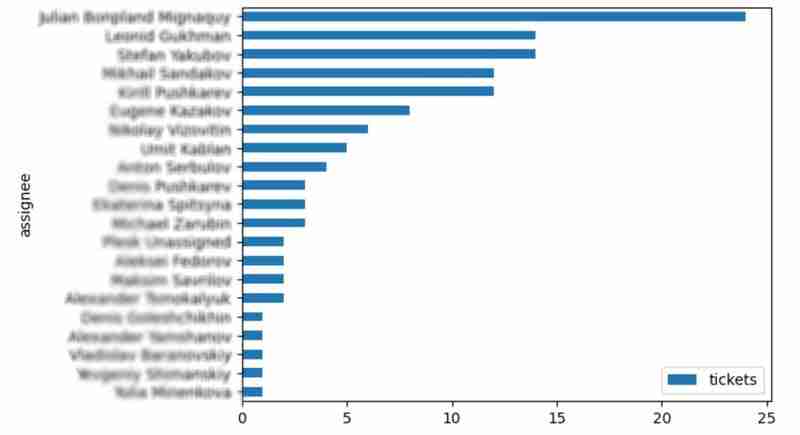
It is also interesting to see the distribution of solved problems by the assignee:
top_solvers = df.groupby('assignee').count()[['time']] top_solvers.rename(columns={'time': 'tickets'}, inplace=True) top_solvers.sort_values('tickets', ascending=False, inplace=True) top_solvers.plot.barh().invert_yaxis()
It may look like the following:
Let's try to predict the amount of time required to finish all open issues. Of course, we can do it without machine learning by using simple approximation and the average time to resolve the issue. So the predicted amount of required time is the number of open issues multiplied by the average time to resolve one. For example, the median time to solve one issue is 2 hours, and we have 9 open issues, so the time required to solve them all is 18 hours (approximation). It's a good enough forecast, but we might know the speed of solving depends on the product, team, and other attributes of the issue. If we want to improve the prediction, we can utilize machine learning to solve this task.
The high-level approach looks the following:
For the first step, we will use a dataset of tickets for the last 30 weeks. Some parts here are simplified for illustrative purposes. In real life, the amount of data for learning should be big enough to make a useful model (e.g., in our case, we need thousands of issues to be analyzed).
issues = jira.search_issues( f'project = PPS AND status IN (Resolved) AND created >= -30w', maxResults=False, fields='summary,issuetype,customfield_10718,customfield_10674,aggregatetimespent', ) closed_tickets = pd.DataFrame([{ 'key': issue.key, 'team': issue.fields.customfield_10718, 'product': issue.fields.customfield_10674, 'time': issue.fields.aggregatetimespent, } for issue in issues]) closed_tickets.set_index('key', inplace=True) closed_tickets['time'].fillna(closed_tickets['time'].median(), inplace=True) closed_tickets
In my case, it's something around 800 tickets and only two fields for "learning": "team" and "product."
The next step is to obtain our target dataset. Why do I do it so early? I want to clean up and do "feature engineering" in one shot for both datasets. Otherwise, the mismatch between the structures can cause problems.
issues = jira.search_issues( f'project = PPS AND status IN (Open, Reopened)', maxResults=False, fields='summary,issuetype,customfield_10718,customfield_10674', ) open_tickets = pd.DataFrame([{ 'key': issue.key, 'team': issue.fields.customfield_10718, 'product': issue.fields.customfield_10674, } for issue in issues]) open_tickets.set_index('key', inplace=True) open_tickets
Please notice we have no "time" column here because we want to predict it. Let's nullify it and combine both datasets to prepare the "features."
open_tickets['time'] = 0 tickets = pd.concat([closed_tickets, open_tickets]) tickets
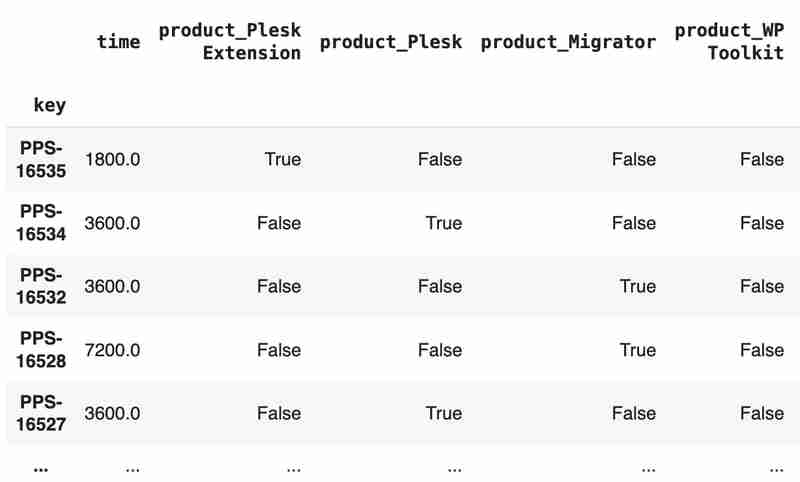
Columns "team" and "product" contain string values. One of the ways of dealing with that is to transform each value into separate fields with boolean flags.
products = pd.get_dummies(tickets['product'], prefix='product') tickets = pd.concat([tickets, products], axis=1) tickets.drop('product', axis=1, inplace=True) teams = pd.get_dummies(tickets['team'], prefix='team') tickets = pd.concat([tickets, teams], axis=1) tickets.drop('team', axis=1, inplace=True) tickets
The result may look like the following:
After the combined dataset preparation, we can split it back into two parts:
closed_tickets = tickets[:len(closed_tickets)] open_tickets = tickets[len(closed_tickets):][:]
Now it's time to train our model:
from sklearn.model_selection import train_test_split from sklearn.tree import DecisionTreeRegressor features = closed_tickets.drop(['time'], axis=1) labels = closed_tickets['time'] features_train, features_val, labels_train, labels_val = train_test_split(features, labels, test_size=0.2) model = DecisionTreeRegressor() model.fit(features_train, labels_train) model.score(features_val, labels_val)
And the final step is to use our model to make a prediction:
open_tickets['time'] = model.predict(open_tickets.drop('time', axis=1, errors='ignore')) open_tickets['time'].sum() / 3600
The final output, in my case, is 25 hours, which is higher than our initial rough estimation. This was a basic example. However, by using ML tools, you can significantly expand your abilities to analyze JIRA data.
Sometimes, JIRA built-in tools and plugins are not sufficient for effective analysis. Moreover, many 3rd party plugins are rather expensive, costing thousands of dollars per year, and you will still struggle to make them work the way you want. However, you can easily utilize well-known data analysis tools by fetching necessary information via JIRA API and go beyond these limitations. I spent so many hours playing with various JIRA plugins in attempts to create good reports for projects, but they often missed some important parts. Building a tool or a full-featured service on top of JIRA API also often looks like overkill. That's why typical data analysis and ML tools like Jupiter, pandas, matplotlib, scikit-learn, and others may work better here.

Das obige ist der detaillierte Inhalt vonJIRA Analytics mit Pandas. Für weitere Informationen folgen Sie bitte anderen verwandten Artikeln auf der PHP chinesischen Website!


