

在本文中,我们将使用 Scikit-Learn 演示完整的机器学习项目工作流程。我们将建立一个模型,根据各种特征(例如收入中位数、房屋年龄和平均房间数量)来预测加州的房价。该项目将指导您完成该过程的每个步骤,包括数据加载、探索、模型训练、评估和结果可视化。无论您是想要了解基础知识的初学者,还是想要复习知识的经验丰富的从业者,本文都将为机器学习技术的实际应用提供宝贵的见解。
加州房地产市场以其独特的特征和定价动态而闻名。在这个项目中,我们的目标是开发一种机器学习模型来根据各种特征预测房价。我们将使用加州住房数据集,其中包括各种属性,例如收入中位数、房屋年龄、平均房间等。
在本节中,我们将导入数据操作、可视化和构建机器学习模型所需的库。
import pandas as pd
import matplotlib.pyplot as plt
from sklearn.model_selection import train_test_split
from sklearn.linear_model import LinearRegression
from sklearn.metrics import mean_squared_error
from sklearn.datasets import fetch_california_housing
我们将加载加州住房数据集并创建一个 DataFrame 来组织数据。目标变量,即房价,将作为新列添加。
# Load the California Housing dataset
california = fetch_california_housing()
df = pd.DataFrame(california.data, columns=california.feature_names)
df['PRICE'] = california.target
为了保持分析的可管理性,我们将从数据集中随机选择 700 个样本进行研究。
# Randomly Selecting 700 Samples
df_sample = df.sample(n=700, random_state=42)
本节将提供数据集的概述,显示前五行以了解数据的特征和结构。
# Overview of the data
print("First five rows of the dataset:")
print(df_sample.head())
First five rows of the dataset:
       MedInc  HouseAge  AveRooms  AveBedrms  Population  AveOccup  Latitude  \
20046  1.6812      25.0  4.192201   1.022284      1392.0  3.877437     36.06
3024   2.5313      30.0  5.039384   1.193493      1565.0  2.679795     35.14
15663  3.4801      52.0  3.977155   1.185877      1310.0  1.360332     37.80
20484  5.7376      17.0  6.163636   1.020202      1705.0  3.444444     34.28
9814   3.7250      34.0  5.492991   1.028037      1063.0  2.483645     36.62

       Longitude    PRICE
20046    -119.01  0.47700
3024     -119.46  0.45800
15663    -122.44  5.00001
20484    -118.72  2.18600
9814     -121.93  2.78000
print(df_sample.info())
<class 'pandas.core.frame.DataFrame'>
Index: 700 entries, 20046 to 5350
Data columns (total 9 columns):
 #   Column      Non-Null Count  Dtype
---  ------      --------------  -----
 0   MedInc      700 non-null    float64
 1   HouseAge    700 non-null    float64
 2   AveRooms    700 non-null    float64
 3   AveBedrms   700 non-null    float64
 4   Population  700 non-null    float64
 5   AveOccup    700 non-null    float64
 6   Latitude    700 non-null    float64
 7   Longitude   700 non-null    float64
 8   PRICE       700 non-null    float64
dtypes: float64(9)
memory usage: 54.7 KB
print(df_sample.describe())
           MedInc    HouseAge    AveRooms   AveBedrms   Population  \
count  700.000000  700.000000  700.000000  700.000000   700.000000
mean     3.937653   28.855714    5.404192    1.079266  1387.422857
std      2.085831   12.353313    1.848898    0.236318  1027.873659
min      0.852700    2.000000    2.096692    0.500000     8.000000
25%      2.576350   18.000000    4.397751    1.005934   781.000000
50%      3.480000   30.000000    5.145295    1.047086  1159.500000
75%      4.794625   37.000000    6.098061    1.098656  1666.500000
max     15.000100   52.000000   36.075472    5.273585  8652.000000

         AveOccup    Latitude   Longitude       PRICE
count  700.000000  700.000000  700.000000  700.000000
mean     2.939913   35.498243 -119.439729    2.082073
std      0.745525    2.123689    1.956998    1.157855
min      1.312994   32.590000 -124.150000    0.458000
25%      2.457560   33.930000 -121.497500    1.218500
50%      2.834524   34.190000 -118.420000    1.799000
75%      3.326869   37.592500 -118.007500    2.665500
max      7.200000   41.790000 -114.590000    5.000010
我们将数据集分为特征(X)和目标变量(y),然后将其分为训练集和测试集,用于模型训练和评估。
# Splitting the dataset into Train and Test sets
X = df_sample.drop('PRICE', axis=1)  # Features
y = df_sample['PRICE']  # Target variable

# Split the dataset into training and testing sets
X_train, X_test, y_train, y_test = train_test_split(X, y, test_size=0.2, random_state=42)
在本节中,我们将使用训练数据创建和训练线性回归模型,以了解特征与房价之间的关系。
# Creating and training the Linear Regression model
lr = LinearRegression()
lr.fit(X_train, y_train)
我们将对测试集进行预测,并计算均方误差 (MSE) 和 R 平方值来评估模型的性能。
# Making predictions on the test set
y_pred = lr.predict(X_test)

# Calculating Mean Squared Error
mse = mean_squared_error(y_test, y_pred)
print(f"\nLinear Regression Mean Squared Error: {mse}")
Linear Regression Mean Squared Error: 0.3699851092128846
在这里,我们将创建一个 DataFrame 来比较实际房价与模型生成的预测价格。
# Displaying Actual vs Predicted Values
results = pd.DataFrame({'Actual Prices': y_test.values, 'Predicted Prices': y_pred})
print("\nActual vs Predicted:")
print(results)
Actual vs Predicted:
     Actual Prices  Predicted Prices
0          0.87500          0.887202
1          1.19400          2.445412
2          5.00001          6.249122
3          2.78700          2.743305
4          1.99300          2.794774
..             ...               ...
135        1.62100          2.246041
136        3.52500          2.626354
137        1.91700          1.899090
138        2.27900          2.731436
139        1.73400          2.017134

[140 rows x

 2 columns]
在最后一部分,我们将使用散点图可视化实际房价和预测房价之间的关系,以直观地评估模型的性能。
# Visualizing the Results
plt.figure(figsize=(8, 6))
plt.scatter(y_test, y_pred, color='blue')
plt.xlabel('Actual Prices')
plt.ylabel('Predicted Prices')
plt.title('Actual vs Predicted House Prices')

# Draw the ideal line
plt.plot([0, 6], [0, 6], color='red', linestyle='--')

# Set limits to minimize empty space
plt.xlim(y_test.min() - 1, y_test.max() + 1)
plt.ylim(y_test.min() - 1, y_test.max() + 1)

plt.grid()
plt.show()
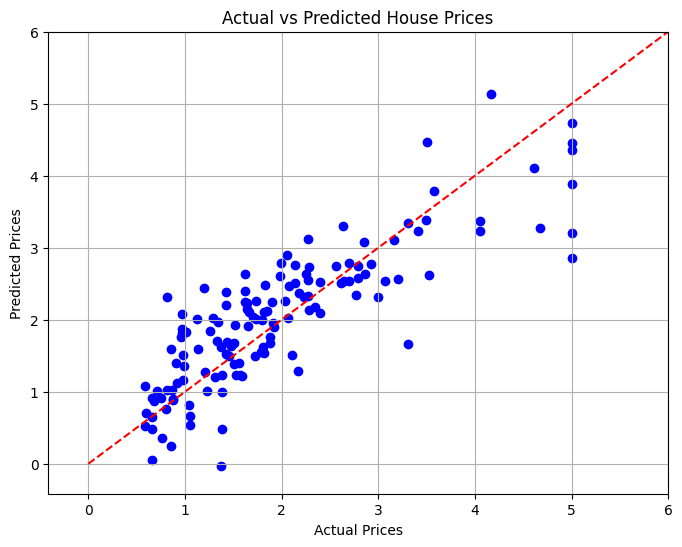
在这个项目中,我们开发了一个线性回归模型来根据各种特征预测加州的房价。计算均方误差来评估模型的性能,从而提供预测准确性的定量测量。通过可视化,我们能够看到我们的模型相对于实际值的表现如何。
该项目展示了机器学习在房地产分析中的强大功能,可以作为更先进的预测建模技术的基础。
以上是使用 Scikit-Learn 完成机器学习工作流程:预测加州房价的详细内容。更多信息请关注PHP中文网其他相关文章!


