

简介
熟能生巧。
这与数据科学家有很多共同点。理论只是等式的一个方面;最关键的是将理论付诸实践。我将努力记录今天开发我的顶点项目的整个过程,其中将涉及研究电影数据集。
这些是目标:
目标:
1。资料收集
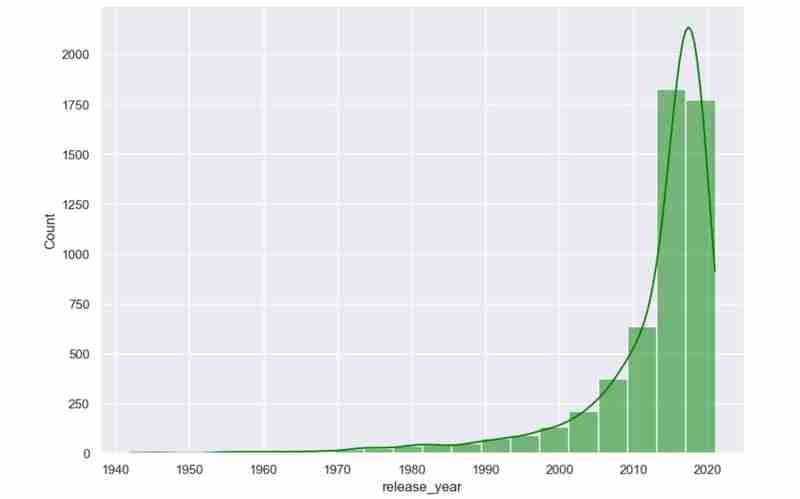
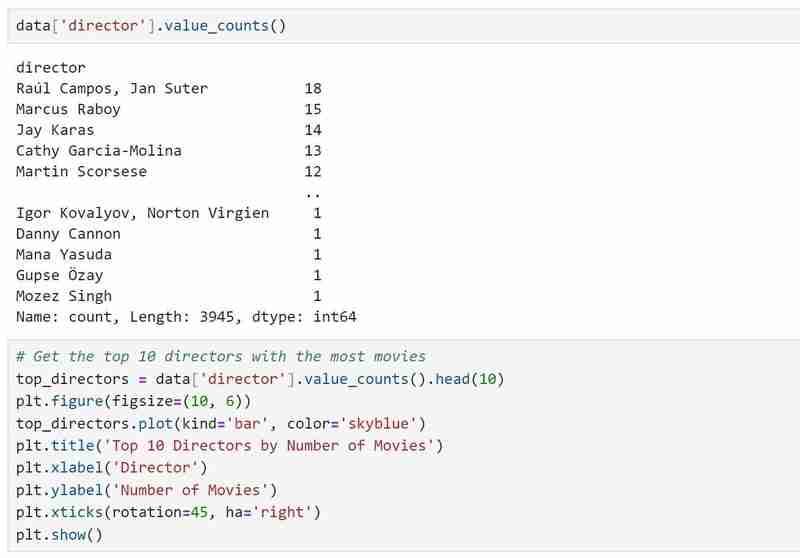
我决定使用 Kaggle 来查找我的数据集。记住您正在使用的数据集所需的关键变量至关重要。重要的是,我的数据集应该包括以下内容:发行年份的趋势、导演的受欢迎程度、收视率和电影类型。因此,我必须确保我选择的数据集至少具有以下内容。
我的数据集位于 Kaggle 上,我将提供下面的链接。您可以通过下载数据集、解压并提取来获取该文件的 CSV 版本。您可以查看它以了解您已经拥有的内容,并真正了解您希望从将要检查的数据中获得什么样的见解。
2。描述数据
首先,我们必须导入所需的库并加载必要的数据。我在我的项目中使用 Python 编程语言和 Jupyter Notebooks,以便我可以更高效地编写和查看代码。
您将导入我们将使用的库并加载数据,如下所示。
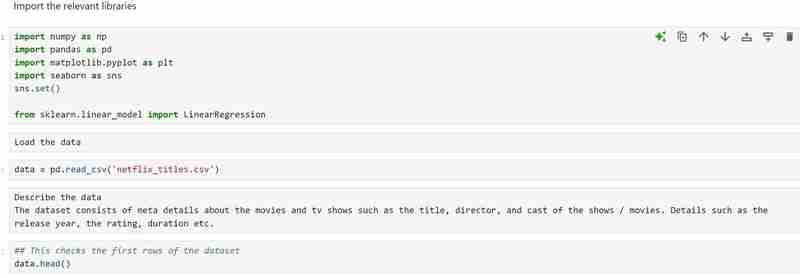
然后我们将运行以下命令来获取有关我们的数据集的更多详细信息。
data.head() # dispalys the first rows of the dataset. data.tail() # displays the last rows of the dataset. data.shape # Shows the total number of rows and columns. len(data.columns) # Shows the total number of columns. data.columns # Describes different column names. data.dtypes # Describes different data types.
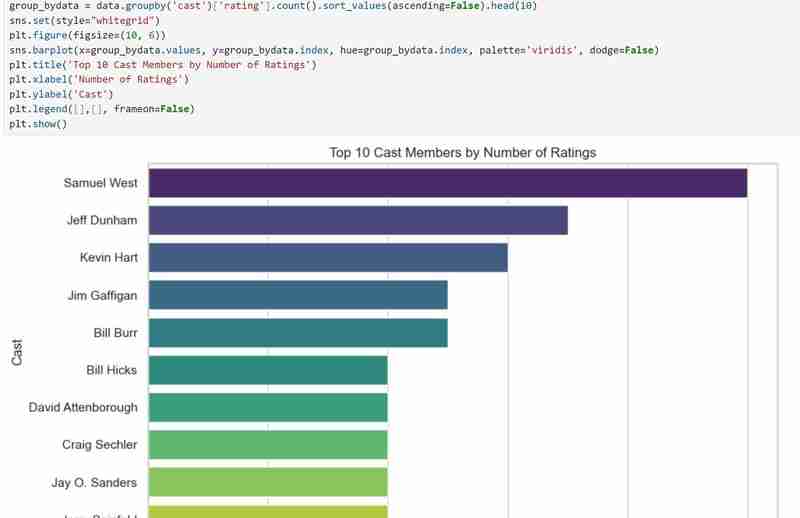
我们现在知道数据集包含什么以及在获得我们需要的所有描述后我们希望提取的见解。示例:使用我的数据集,我希望调查导演受欢迎程度、收视率分布和电影类型的模式。我还想根据用户选择的偏好推荐电影,例如喜欢的导演和类型。
3。数据清理
此阶段涉及查找任何空值并将其删除。为了继续进行数据可视化,我们还将检查数据集是否有重复项,并删除我们发现的任何内容。为此,我们将运行以下代码:
1. data['show_id'].value_counts().sum() # Checks for the total number of rows in my dataset 2. data.isna().sum() # Checks for null values(I found null values in director, cast and country columns) 3. data[['director', 'cast', 'country']] = data[['director', 'cast', 'country']].replace(np.nan, "Unknown ") # Fill null values with unknown.
然后我们将删除具有未知值的行并确认我们已删除所有这些行。我们还将检查已清理数据的剩余行数。
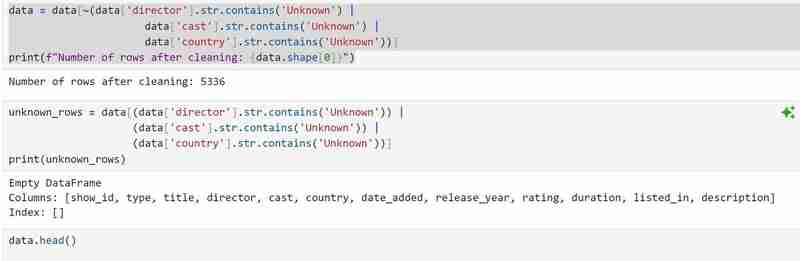
下面的代码查找独特的特征和重复项。尽管我的数据集中没有重复项,但您可能仍然需要使用它,以防将来的数据集出现重复项。
data.duplicated().sum() # Checks for duplicates data.nunique() # Checks for unique features data.info # Confirms if nan values are present and also shows datatypes.
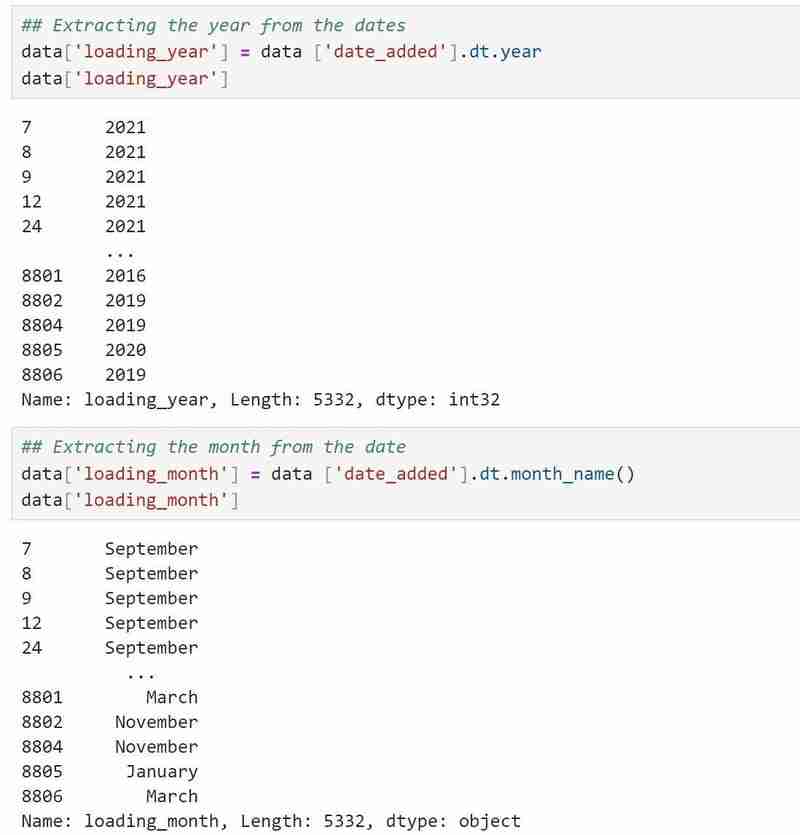
我的日期/时间数据类型是一个对象,我希望它采用正确的日期/时间格式,所以我使用了
data['date_added']=data['date_added'].astype('datetime64[ms]')将其转换为正确的格式。
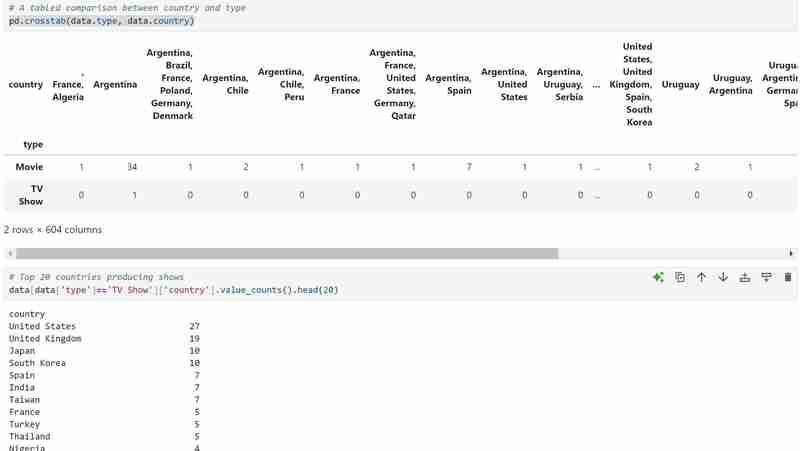
4。数据可视化
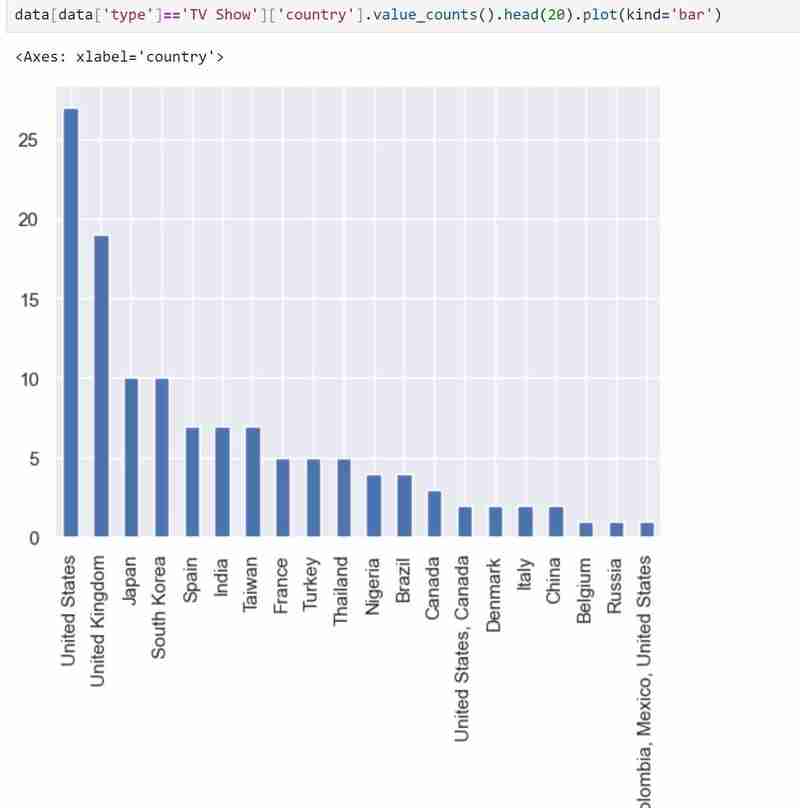
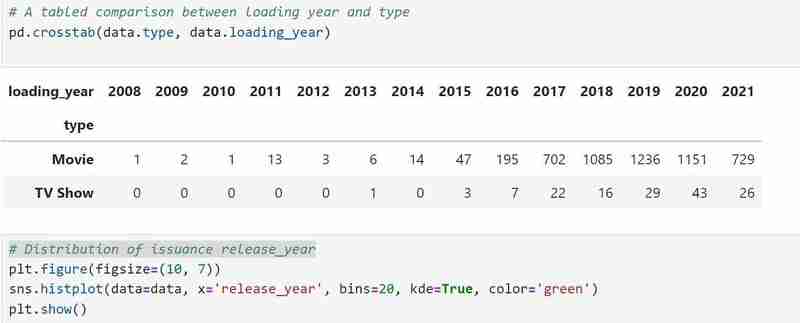
我的数据集有两种类型的变量,即类型中的电视节目和电影,我使用条形图来呈现分类数据及其代表的值。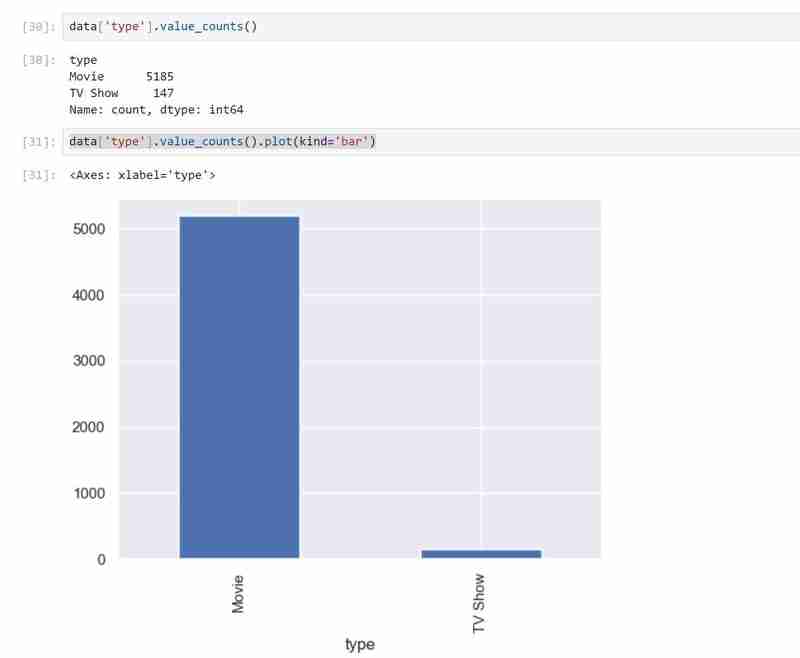
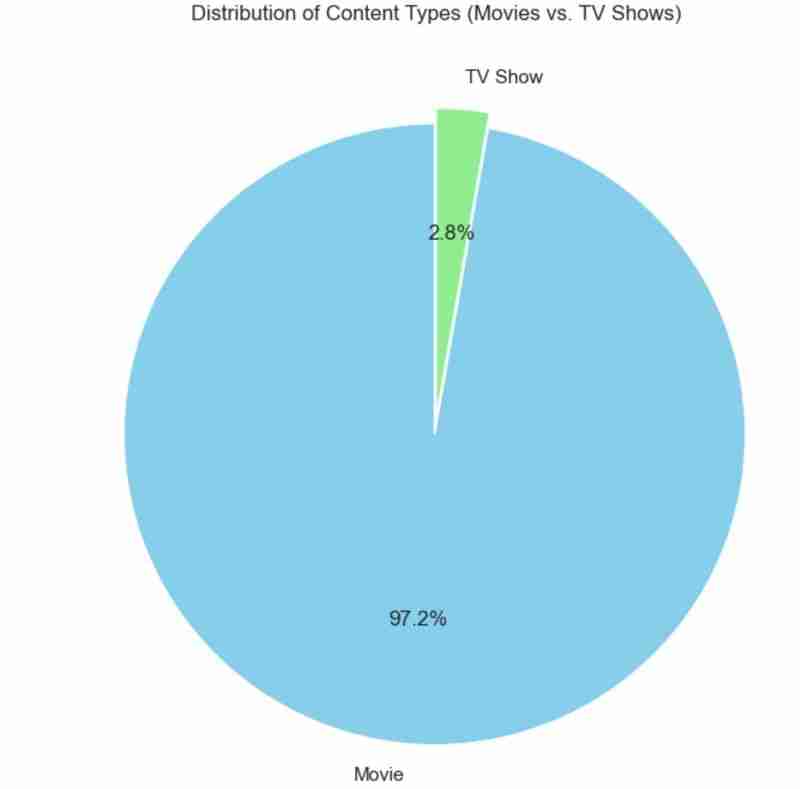
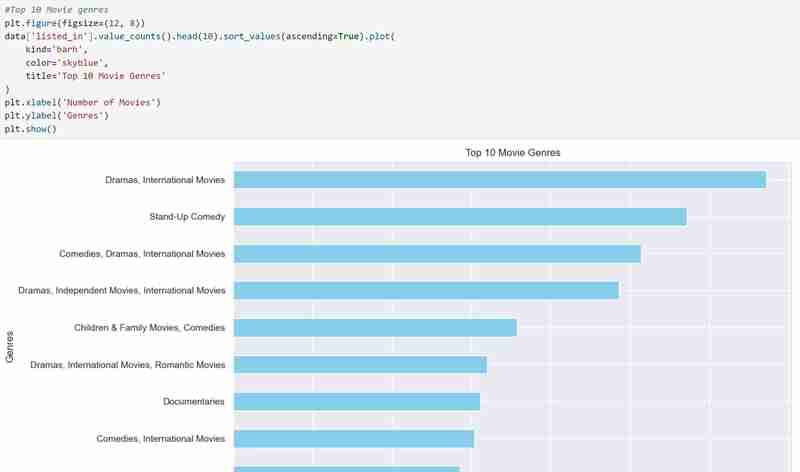
我也用饼图来表示,和上面一样。使用的代码如下,预期结果如下所示。
## Pie chart display plt.figure(figsize=(8, 8)) data['type'].value_counts().plot( kind='pie', autopct='%1.1f%%', colors=['skyblue', 'lightgreen'], startangle=90, explode=(0.05, 0) ) plt.title('Distribution of Content Types (Movies vs. TV Shows)') plt.ylabel('') plt.show()
5. Recommendation System
I then built a recommendation system that takes in genre or director's name as input and produces a list of movies as per the user's preference. If the input cannot be matched by the algorithm then the user is notified.
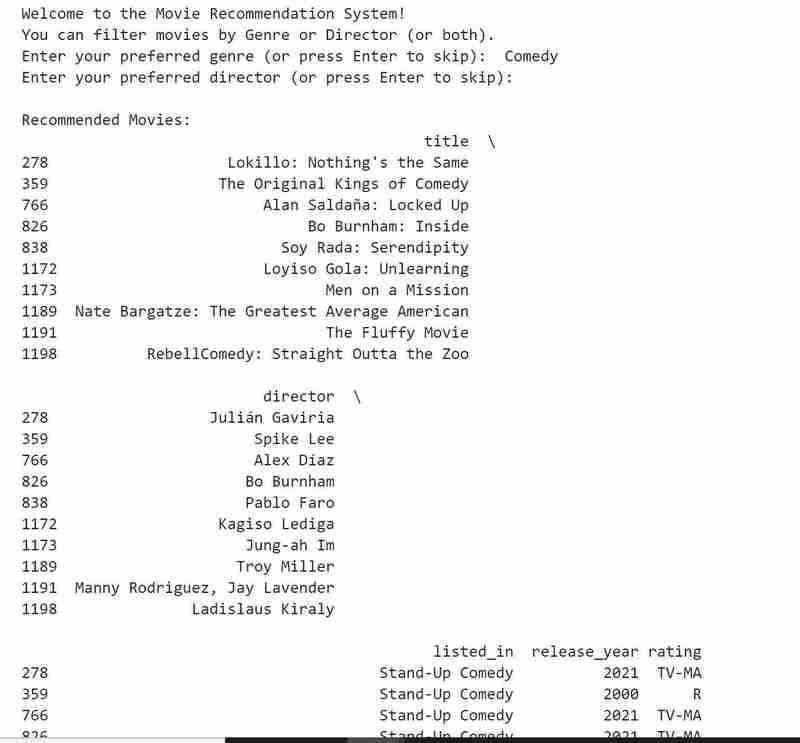
The code for the above is as follows:
def recommend_movies(genre=None, director=None): recommendations = data if genre: recommendations = recommendations[recommendations['listed_in'].str.contains(genre, case=False, na=False)] if director: recommendations = recommendations[recommendations['director'].str.contains(director, case=False, na=False)] if not recommendations.empty: return recommendations[['title', 'director', 'listed_in', 'release_year', 'rating']].head(10) else: return "No movies found matching your preferences." print("Welcome to the Movie Recommendation System!") print("You can filter movies by Genre or Director (or both).") user_genre = input("Enter your preferred genre (or press Enter to skip): ") user_director = input("Enter your preferred director (or press Enter to skip): ") recommendations = recommend_movies(genre=user_genre, director=user_director) print("\nRecommended Movies:") print(recommendations)
Conclusion
My goals were achieved, and I had a great time taking on this challenge since it helped me realize that, even though learning is a process, there are days when I succeed and fail. This was definitely a success. Here, we celebrate victories as well as defeats since, in the end, each teach us something. Do let me know if you attempt this.
Till next time!
Note!!
The code is in my GitHub:
https://github.com/MichelleNjeri-scientist/Movie-Dataset-Exploration-and-Visualization
The Kaggle dataset is:
https://www.kaggle.com/datasets/shivamb/netflix-shows
以上是电影数据集探索和可视化的详细内容。更多信息请关注PHP中文网其他相关文章!


