

Hi, In previous blog we talked about how we can do raster analysis using h3 indexes and postgresql for a single band raster. In this blog we will talk about how we can process multiband raster and create indices with ease. We will be using sentinel-2 image and create NDVI from the processed h3 cells and visualize the results
We are downloading the sentinel 2 data from https://apps.sentinel-hub.com/eo-browser/ in Pokhara, Nepal Area , Just to make sure lake is in the image grid so that it would be easy for us to validate the NDVI result
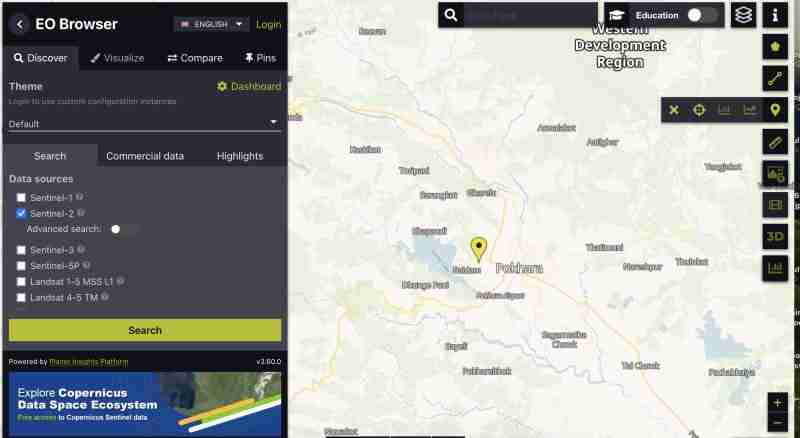
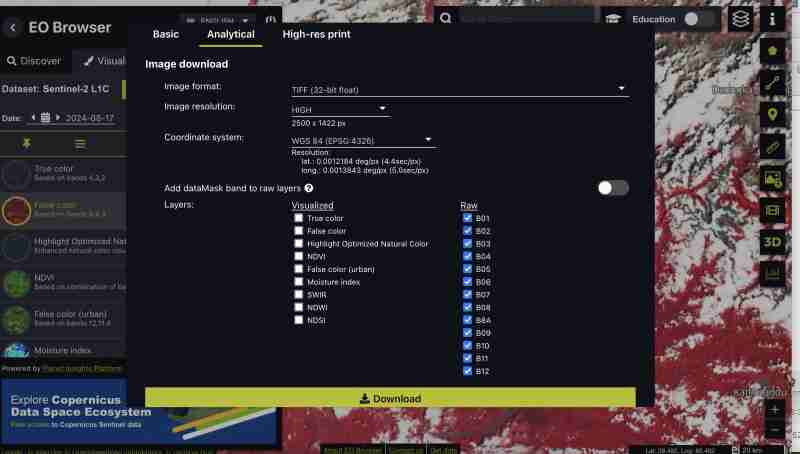
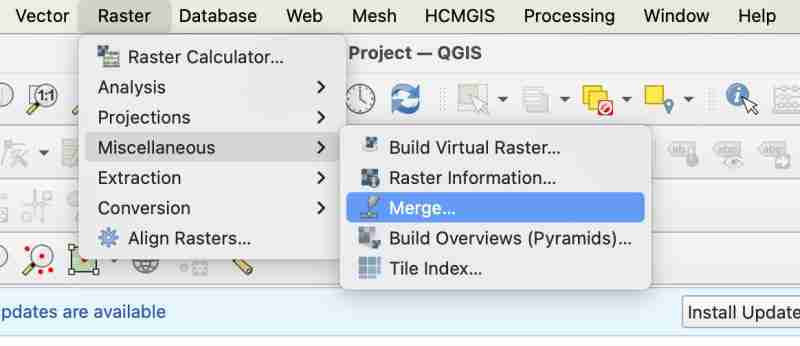
To download sentinel image with all bands :
 icon on right vertical bar
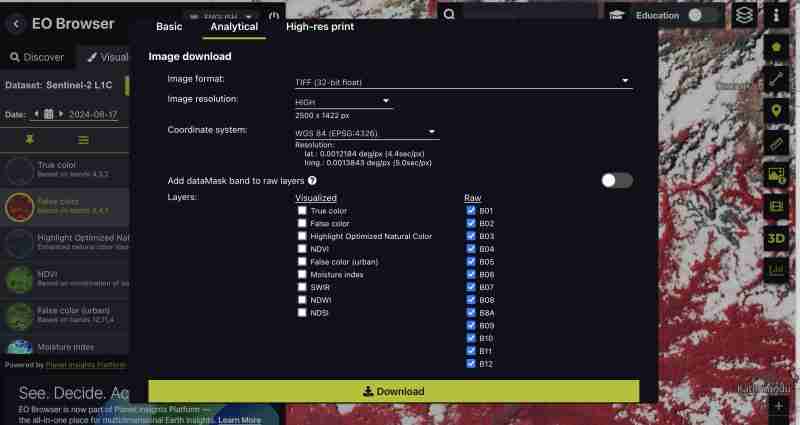
You can also download pregenerated indices such as NDVI , False color tiff only or specific bands whichever best suits your need . We are downloading all the bands as we wanna do the processing by ourselves
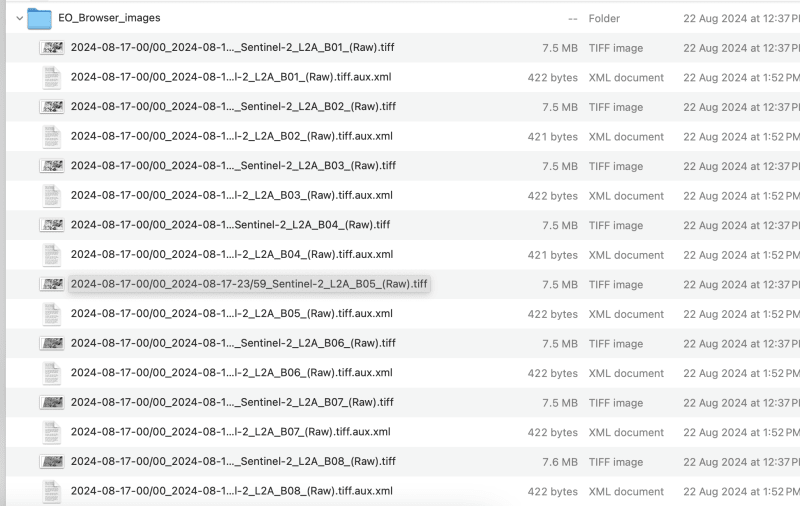
We get all the bands as separate tiff from the sentinel as we downloaded raw format
This can be done through GIS tools or gdal
We need to rename the downloaded file to band1,band2 like this to avoid slashes in the filename
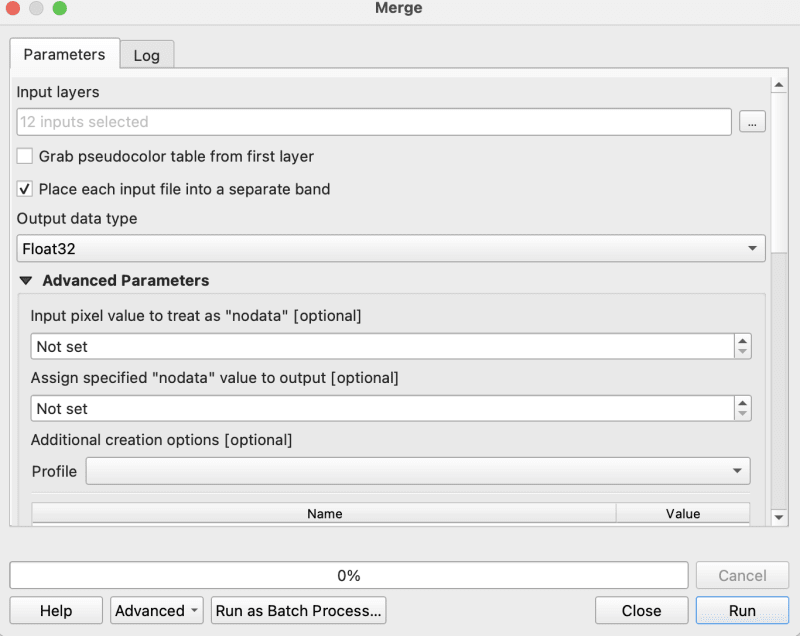
Lets process upto band 9 for this exercise , you can choose the band as your requirement
gdal_merge.py -separate -o sentinel2_composite.tif band1.tif band2.tif band3.tif band4.tif band5.tif band6.tif band7.tif band8.tif band9.tif
gdalwarp -overwrite -dstnodata 0 "$input_file" "${output_file}_nodata.tif"
gdal_translate -of COG "$input_file" "$output_file"
I am using the bash script provided in cog2h3 repo to automate those
sudo bash pre.sh sentinel2_composite.tif
Now finally as we have done the preprocessing script , lets move forward to compute h3 cells for each bands in the composite cog image
pip install cog2h3
export DATABASE_URL="postgresql://user:password@host:port/database"
We are using resolution 10 for this sentinel image, however you will also see in the script itself which will print the optimal resolution for your raster that makes the h3 cell smaller than your smallest of pixel in raster.
cog2h3 --cog sentinel2_composite_preprocessed.tif --table sentinel --multiband --res 10
It took a minute for us to compute and store result in postgresql
Logs :
2024-08-24 08:39:43,233 - INFO - Starting processing
2024-08-24 08:39:43,234 - INFO - COG file already exists at sentinel2_composite_preprocessed.tif
2024-08-24 08:39:43,234 - INFO - Processing raster file: sentinel2_composite_preprocessed.tif
2024-08-24 08:39:43,864 - INFO - Determined Min fitting H3 resolution for band 1: 11
2024-08-24 08:39:43,865 - INFO - Resampling original raster to: 200.786148m
2024-08-24 08:39:44,037 - INFO - Resampling Done for band 1
2024-08-24 08:39:44,037 - INFO - New Native H3 resolution for band 1: 10
2024-08-24 08:39:44,738 - INFO - Calculation done for res:10 band:1
2024-08-24 08:39:44,749 - INFO - Determined Min fitting H3 resolution for band 2: 11
2024-08-24 08:39:44,749 - INFO - Resampling original raster to: 200.786148m
2024-08-24 08:39:44,757 - INFO - Resampling Done for band 2
2024-08-24 08:39:44,757 - INFO - New Native H3 resolution for band 2: 10
2024-08-24 08:39:45,359 - INFO - Calculation done for res:10 band:2
2024-08-24 08:39:45,366 - INFO - Determined Min fitting H3 resolution for band 3: 11
2024-08-24 08:39:45,366 - INFO - Resampling original raster to: 200.786148m
2024-08-24 08:39:45,374 - INFO - Resampling Done for band 3
2024-08-24 08:39:45,374 - INFO - New Native H3 resolution for band 3: 10
2024-08-24 08:39:45,986 - INFO - Calculation done for res:10 band:3
2024-08-24 08:39:45,994 - INFO - Determined Min fitting H3 resolution for band 4: 11
2024-08-24 08:39:45,994 - INFO - Resampling original raster to: 200.786148m
2024-08-24 08:39:46,003 - INFO - Resampling Done for band 4
2024-08-24 08:39:46,003 - INFO - New Native H3 resolution for band 4: 10
2024-08-24 08:39:46,605 - INFO - Calculation done for res:10 band:4
2024-08-24 08:39:46,612 - INFO - Determined Min fitting H3 resolution for band 5: 11
2024-08-24 08:39:46,612 - INFO - Resampling original raster to: 200.786148m
2024-08-24 08:39:46,619 - INFO - Resampling Done for band 5
2024-08-24 08:39:46,619 - INFO - New Native H3 resolution for band 5: 10
2024-08-24 08:39:47,223 - INFO - Calculation done for res:10 band:5
2024-08-24 08:39:47,230 - INFO - Determined Min fitting H3 resolution for band 6: 11
2024-08-24 08:39:47,230 - INFO - Resampling original raster to: 200.786148m
2024-08-24 08:39:47,239 - INFO - Resampling Done for band 6
2024-08-24 08:39:47,239 - INFO - New Native H3 resolution for band 6: 10
2024-08-24 08:39:47,829 - INFO - Calculation done for res:10 band:6
2024-08-24 08:39:47,837 - INFO - Determined Min fitting H3 resolution for band 7: 11
2024-08-24 08:39:47,837 - INFO - Resampling original raster to: 200.786148m
2024-08-24 08:39:47,845 - INFO - Resampling Done for band 7
2024-08-24 08:39:47,845 - INFO - New Native H3 resolution for band 7: 10
2024-08-24 08:39:48,445 - INFO - Calculation done for res:10 band:7
2024-08-24 08:39:48,453 - INFO - Determined Min fitting H3 resolution for band 8: 11
2024-08-24 08:39:48,453 - INFO - Resampling original raster to: 200.786148m
2024-08-24 08:39:48,461 - INFO - Resampling Done for band 8
2024-08-24 08:39:48,461 - INFO - New Native H3 resolution for band 8: 10
2024-08-24 08:39:49,046 - INFO - Calculation done for res:10 band:8
2024-08-24 08:39:49,054 - INFO - Determined Min fitting H3 resolution for band 9: 11
2024-08-24 08:39:49,054 - INFO - Resampling original raster to: 200.786148m
2024-08-24 08:39:49,062 - INFO - Resampling Done for band 9
2024-08-24 08:39:49,063 - INFO - New Native H3 resolution for band 9: 10
2024-08-24 08:39:49,647 - INFO - Calculation done for res:10 band:9
2024-08-24 08:39:51,435 - INFO - Converting H3 indices to hex strings
2024-08-24 08:39:51,906 - INFO - Overall raster calculation done in 8 seconds
2024-08-24 08:39:51,906 - INFO - Creating or replacing table sentinel in database
2024-08-24 08:40:03,153 - INFO - Table sentinel created or updated successfully in 11.25 seconds.
2024-08-24 08:40:03,360 - INFO - Processing completed
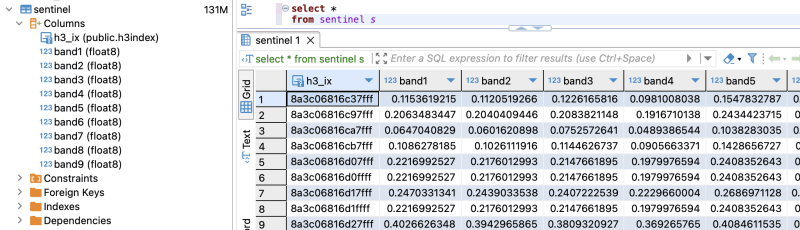
Since now we have our data in postgresql , Lets do some analysis
select *
from sentinel
explain analyze
select h3_ix , (band8-band4)/(band8+band4) as ndvi
from public.sentinel
Query Plan :
QUERY PLAN                                                                                                       |
-----------------------------------------------------------------------------------------------------------------+
Seq Scan on sentinel  (cost=0.00..28475.41 rows=923509 width=16) (actual time=0.014..155.049 rows=923509 loops=1)|
Planning Time: 0.080 ms                                                                                          |
Execution Time: 183.764 ms                                                                                       |
As you can see here for all the rows in that area the calculation is instant . This is true for all other indices and you can compute complex indices join with other tables using the h3_ix primary key and derive meaningful result out of it without worrying as postgresql is capable of handling complex queries and table join.
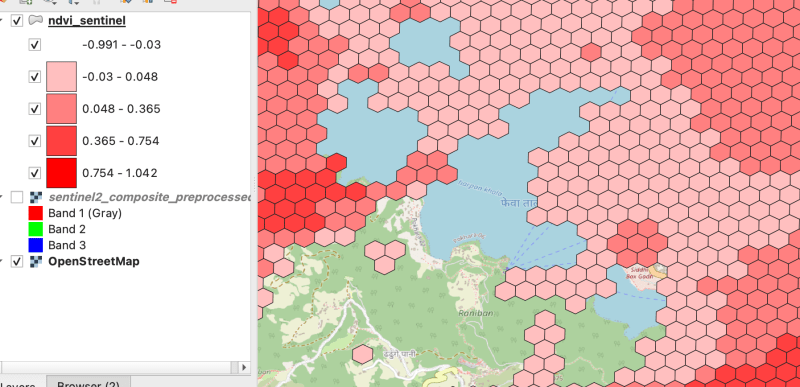
Lets visualize and verify if the computed indices are true
create table ndvi_sentinel
as(
select h3_ix , (band8-band4)/(band8+band4) as ndvi
from public.sentinel )
ALTER TABLE ndvi_sentinel
ADD COLUMN geometry geometry(Polygon, 4326)
GENERATED ALWAYS AS (h3_cell_to_boundary_geometry(h3_ix)) STORED;
create index on ndvi_sentinel(geometry);
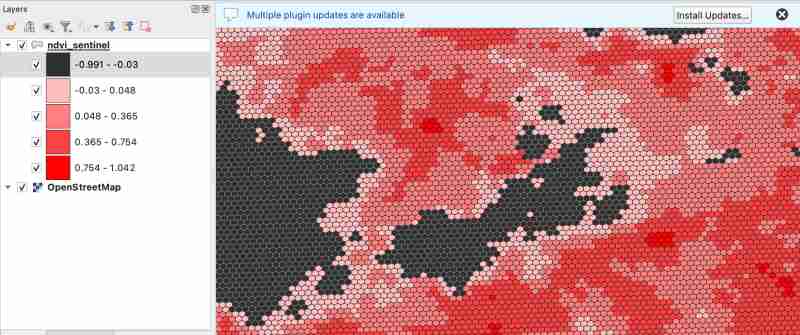
As we know value between -1.0 to 0.1 should represent Deep water or dense clouds
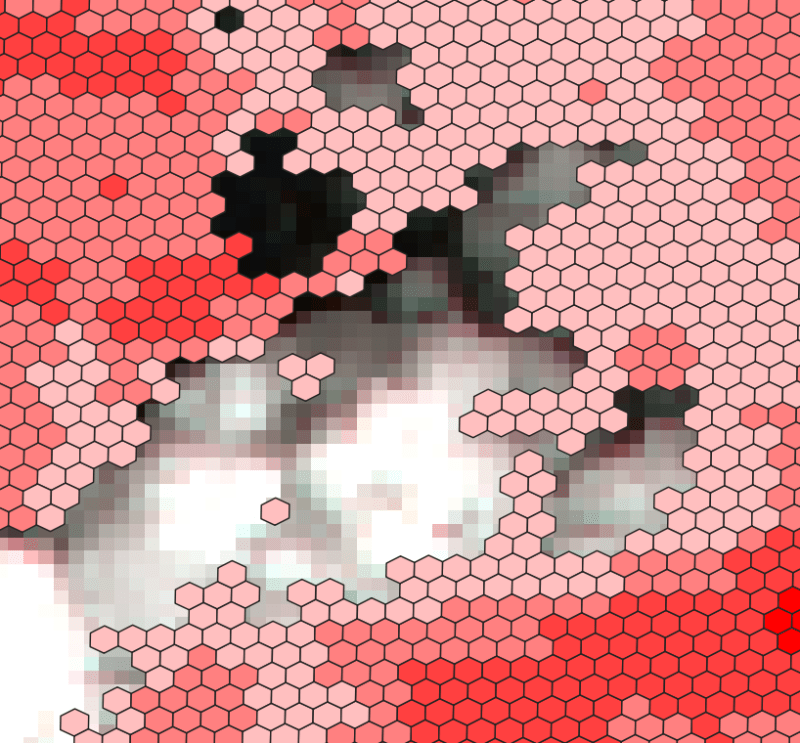
lets see if thats true ( making first category as transparent to see the underlying image )
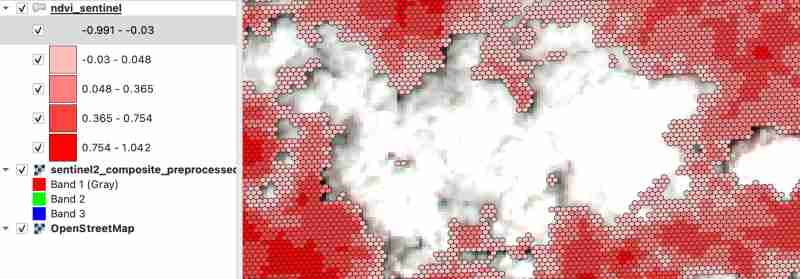
As there were clouds around the lake hence nearby fields are covered by cloud which makes sense
Thank you for reading ! See you in next blog
以上是Process multiband rasters (Sentinel-with hndex and create indices的详细内容。更多信息请关注PHP中文网其他相关文章!


