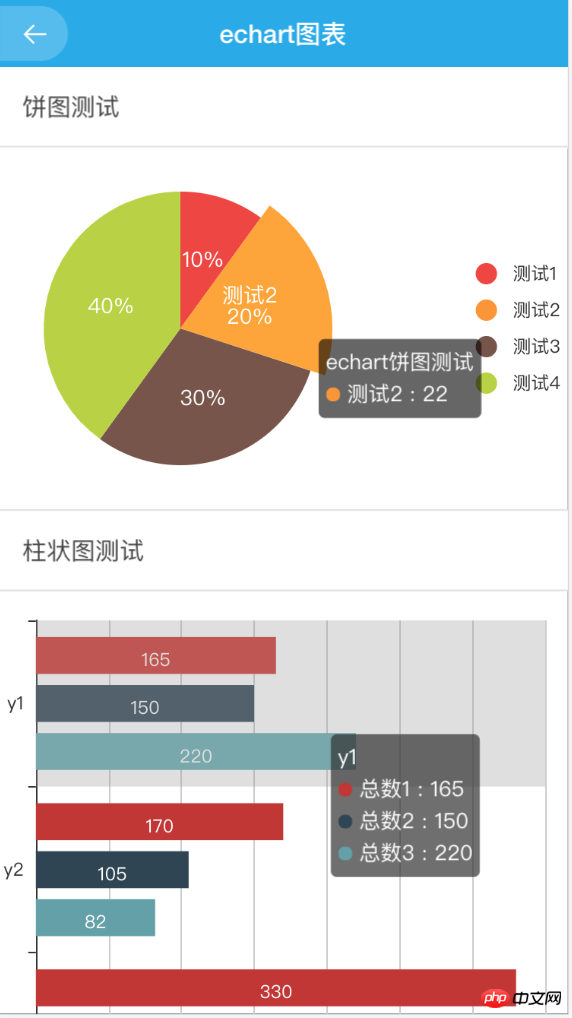
ehcart是百度做的資料圖表,是基於原生js。介面和配置都寫的很好很易讀,還可以用於商用。本文主要介紹了詳解angularjs實現echart圖表效果最簡潔教程,小編覺得挺不錯的,現在分享給大家,也給大家做個參考。一起跟著小編過來看看吧,希望能幫助大家。
一 echart套件引用
下載解壓縮,放入lib。
下載位址:echart_jb51.rar
並在index.html中引用如圖兩個js檔案。

app.js中引用angular-echarts

二頁
html頁面
<!--饼图-->
  <p>
   <donut-chart config="donutConfig" data="dataList.incomeData">
   </donut-chart>
  </p>
<!--柱状图-->
 <p id="id0001" style="width: 100%;height: 400px; padding: 0;margin: 0; border-width: 0; ">
 </p>
controller
/**
 * Created by xiehan on 2017/11/29.
 */
angular.module('studyApp.controllers')

 .controller('EchartCtrl', function ($scope, $rootScope, $ionicHistory,$location) {

  $scope.title = 'echart图表';

  /*
   官方实例链接:http://echarts.baidu.com/examples.html
   */

  $scope.goBack = function () {
   $ionicHistory.goBack();
  };

  //用于数据的格式化
  $scope.dataList = {
   incomeData:""
  };
  // 饼图
  $scope.pieConfig = {};
  // 环形图
  $scope.donutConfig = {};

  init();

  function init() {
   initChartsConfig();
   initIncome();
   initConfigChart();
  }

  //饼图配置初始化
  function initChartsConfig() {
   $scope.pieConfig = {
    center: [120, '50%'],
    radius: 90
   };
   $scope.donutConfig = {
    radius: [0, 90]
   };
  }
  //饼图数据
  function initIncome(){
   var temp = [
    {
     NAME:"测试1",
     NUM:11
    },
    {
     NAME:"测试2",
     NUM:22
    },
    {
     NAME:"测试3",
     NUM:33
    },
    {
     NAME:"测试4",
     NUM:44
    }
   ];

   if (temp) {
    // 处理数据
    var temp2 = [];
    angular.forEach(temp, function (item) {
     var t = {x: item.NAME, y: item.NUM};
     temp2.push(t);
    });
    $scope.dataList.incomeData = [{
     name: 'echart饼图测试',
     datapoints: temp2
    }];
   }
  }

  //柱状图数据
  function initConfigChart() {
   var parkaccountChart = echarts.init(document.getElementById('id0001'));//p 标签id
   var seriesLabel = {
    normal: {
     show: true,
     textBorderColor: '#333',
     textBorderWidth: 2
    }
   };
   var option = {
    tooltip: {
     trigger: 'axis',
     axisPointer: {
      type: 'shadow'
     }
    },
    legend: {
     data: ['总数1', '总数2', '总数3'],
     bottom:true
    },
    grid: {
     left: '1%',
     right: '4%',
     bottom: '8%',
     top:'5%',
     containLabel: true
    },
    xAxis: {
     type: 'value',
     name: '',
     axisLabel: {
      formatter: '{value}'
     }
    },
    yAxis: {
     type: 'category',
     inverse: true,
     data: ['y1', 'y2', 'y3']
    },
    series: [
     {
      name: '总数1',
      type: 'bar',
      label: seriesLabel,
      data: [165, 170, 330]
     },
     {
      name: '总数2',
      type: 'bar',
      label: seriesLabel,
      data: [150, 105, 110]
     },
     {
      name: '总数3',
      type: 'bar',
      label: seriesLabel,
      data: [220, 82, 63]
     }
    ]
   };
   parkaccountChart.setOption(option);

  }

});效果圖

#相關推薦:
以上是angularjs實作echart圖表效果簡單實作教程的詳細內容。更多資訊請關注PHP中文網其他相關文章!


