處理多波段柵格(Sentinel-使用 hndex 並建立索引

WBOY
發布: 2024-08-25 06:01:33
原創
730 人瀏覽過

嗨,在先前的部落格中,我們討論如何使用 h3 索引和 postgresql 對單波段柵格進行柵格分析。在本部落格中,我們將討論如何處理多波段柵格並輕鬆建立索引。我們將使用 Sentinel-2 影像並從處理後的 h3 細胞創建 NDVI 並視覺化結果

下載哨兵2數據

我們正在從尼泊爾博卡拉地區的https://apps.sentinel-hub.com/eo-browser/下載sentinel 2數據,只是為了確保湖泊在圖像網格中,以便我們可以輕鬆地驗證 NDVI 結果
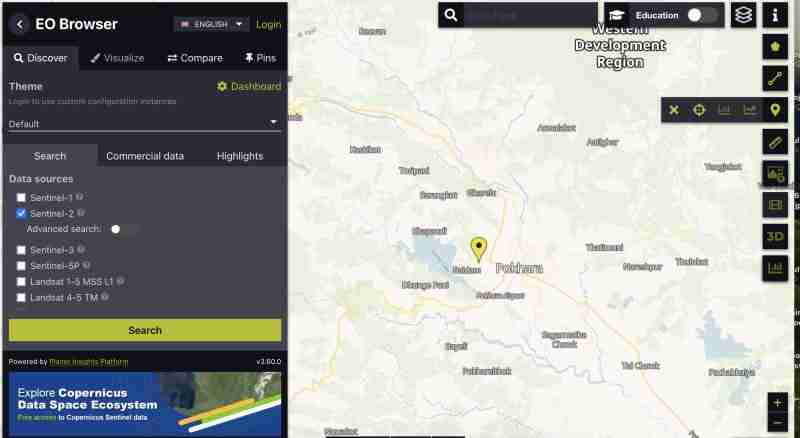
Process multiband rasters (Sentinel-with hndex and create indices

要下載所有樂團的哨兵圖片:

  • 您需要建立一個帳戶
  • 找到您所在區域的影像,選擇覆蓋您感興趣區域的網格
  • 放大到網格,然後點選右側垂直條上的Process multiband rasters (Sentinel-with hndex and create indices圖示
  • 之後進入分析標籤並選擇影像格式為 tiff 32 位元、高解析度、wgs1984 格式的所有波段並檢查所有波段

Process multiband rasters (Sentinel-with hndex and create indices

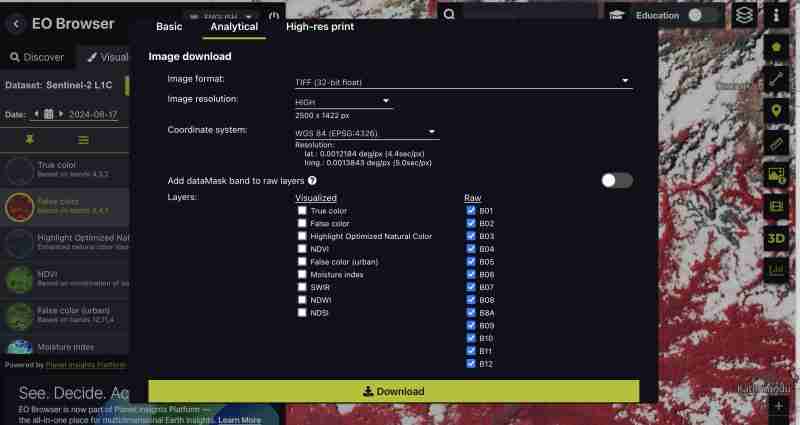
您也可以下載預先產生的指數,例如 NDVI、僅假色 tiff 或最適合您需求的特定波段。我們正在下載所有樂隊,因為我們想自己進行處理

  • 點擊下載

Process multiband rasters (Sentinel-with hndex and create indices

預處理

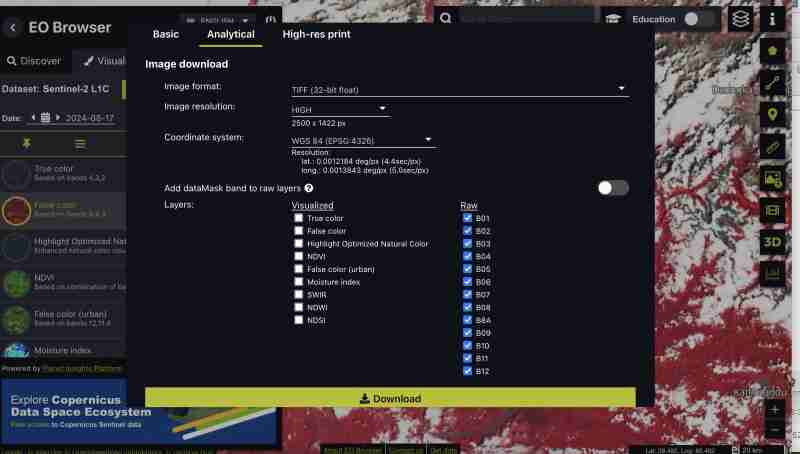
當我們下載原始格式時,我們將所有樂隊作為與哨兵分開的 tiff

Process multiband rasters (Sentinel-with hndex and create indices

  • 讓我們創建一個合成圖像:

這可以透過GIS工具或gdal來完成

  1. 使用 gdal_merge:

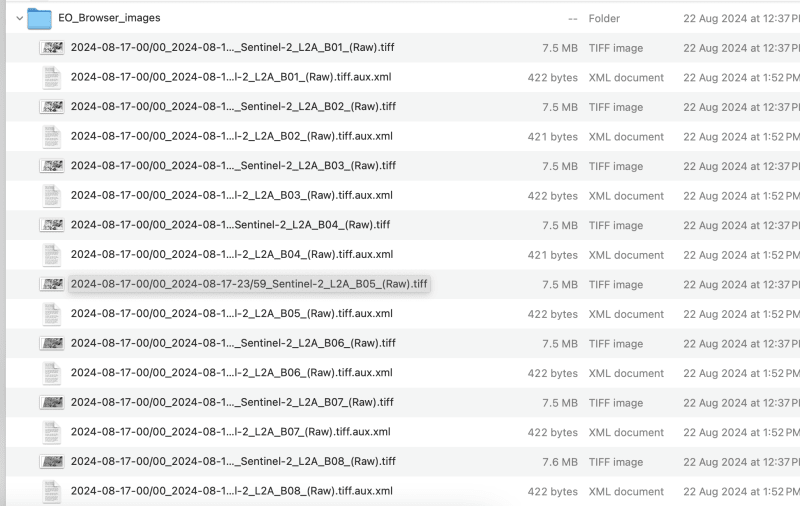
我們需要將下載的檔案重新命名為 band1,band2 以避免檔案名稱中出現斜線
本次練習最多處理頻段 9,您可以依需求選擇頻段

雷雷
  1. 使用 QGIS:
  • 將所有單獨的波段載入到 QGIS
  • 轉到光柵>雜項>合併

Process multiband rasters (Sentinel-with hndex and create indices

  • 合併時,您需要確保選取「將每個輸入檔案放入 sep band」

Process multiband rasters (Sentinel-with hndex and create indices

  • 現在將合併的 tiff 作為複合材料導出到原始 geotiff

家政

  • 確保您的影像採用 WGS1984 在我們的例子中,圖像已經是 ws1984,所以不需要轉換
  • 確保您沒有任何 nodata 如果有則用 0 填充
雷雷
  • 最後確保你的輸出影像是COG
雷雷

我正在使用 cog2h3 repo 中提供的 bash 腳本來自動化這些

雷雷

h3細胞的處理與創建

現在,我們終於完成了預處理腳本,讓我們繼續計算複合齒輪影像中每個波段的 h3 單元格

  • 安裝cog2h3
雷雷
  • 匯出您的資料庫憑證
雷雷
  • 奔跑

我們對此哨兵圖像使用分辨率 10,但是您也會在腳本本身中看到,它將列印柵格的最佳分辨率,使 h3 單元小於柵格中的最小像素。

雷雷

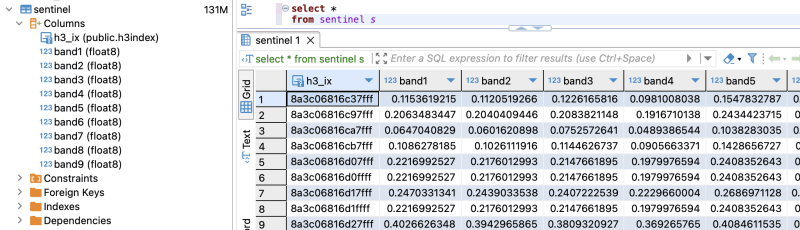
我們花了一分鐘來計算結果並將結果儲存在 postgresql 中

日誌:

雷雷

分析

現在我們的資料在 postgresql 中,讓我們做一些分析

  • 驗證我們是否擁有處理過的所有頻段(記住我們處理的是頻段 1 到頻段 9)
雷雷

Process multiband rasters (Sentinel-with hndex and create indices

  • 計算每個細胞的 ndvi
雷雷

查詢計畫:

QUERY PLAN | -----------------------------------------------------------------------------------------------------------------+ Seq Scan on sentinel (cost=0.00..28475.41 rows=923509 width=16) (actual time=0.014..155.049 rows=923509 loops=1)| Planning Time: 0.080 ms | Execution Time: 183.764 ms |
登入後複製

As you can see here for all the rows in that area the calculation is instant . This is true for all other indices and you can compute complex indices join with other tables using the h3_ix primary key and derive meaningful result out of it without worrying as postgresql is capable of handling complex queries and table join.

Visualize and verification

Lets visualize and verify if the computed indices are true

  • Create table ( for visualizing in QGIS )
create table ndvi_sentinel as( select h3_ix , (band8-band4)/(band8+band4) as ndvi from public.sentinel )
登入後複製
  • Lets add geometry to visualize the h3 cells This is only necessary to visualize in QGIS , if you build an minimal API by yourself you don't need this as you can construct geometry directly from query
ALTER TABLE ndvi_sentinel ADD COLUMN geometry geometry(Polygon, 4326) GENERATED ALWAYS AS (h3_cell_to_boundary_geometry(h3_ix)) STORED;
登入後複製
  • Create index on geometry
create index on ndvi_sentinel(geometry);
登入後複製
  • Connect your database in QGIS and visualize the table on the basis of ndvi value Lets get the area near Fewa lake or cloud

Process multiband rasters (Sentinel-with hndex and create indices

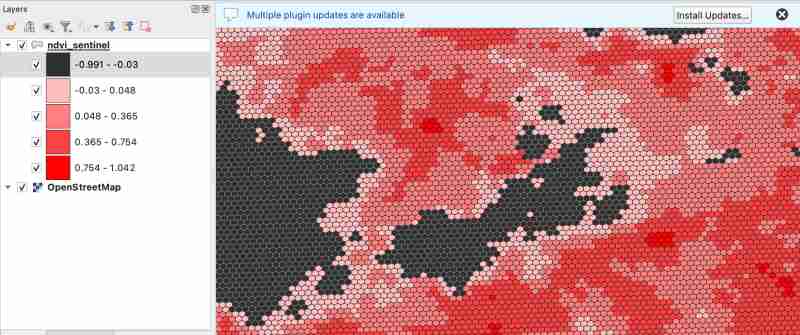
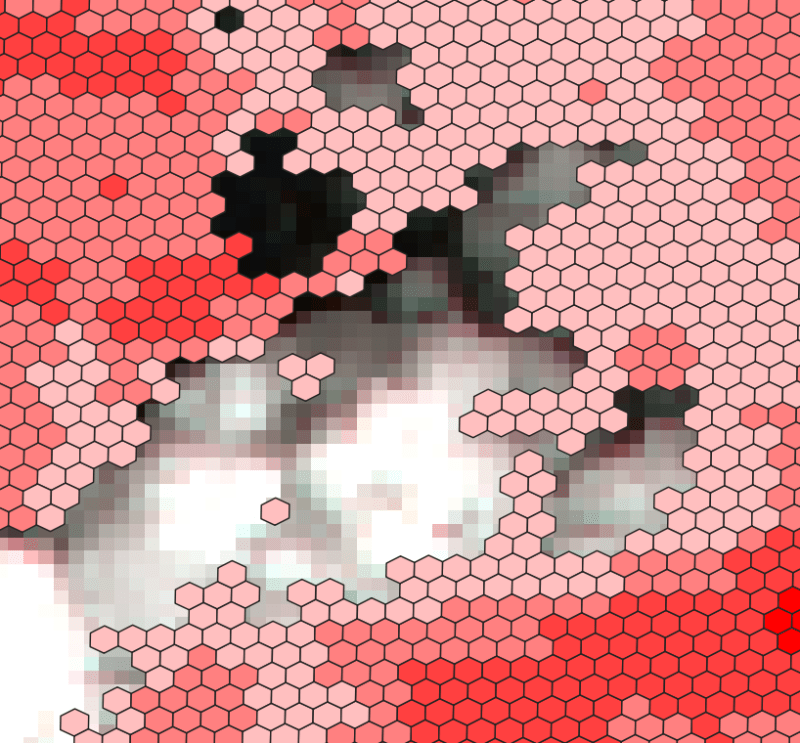
As we know value between -1.0 to 0.1 should represent Deep water or dense clouds
lets see if thats true ( making first category as transparent to see the underlying image )

  • Check clouds :

Process multiband rasters (Sentinel-with hndex and create indices

  • Check Lake

Process multiband rasters (Sentinel-with hndex and create indices
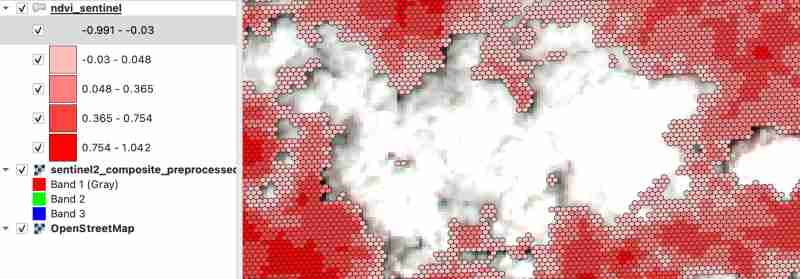
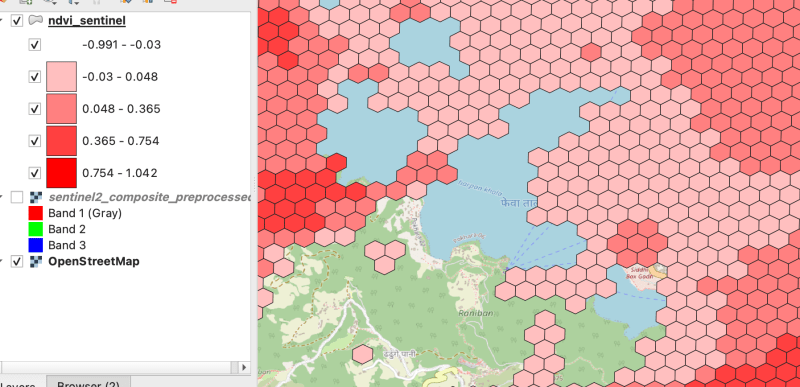
As there were clouds around the lake hence nearby fields are covered by cloud which makes sense

Process multiband rasters (Sentinel-with hndex and create indices

Thank you for reading ! See you in next blog

以上是處理多波段柵格(Sentinel-使用 hndex 並建立索引的詳細內容。更多資訊請關注PHP中文網其他相關文章!

來源:dev.to
本網站聲明
本文內容由網友自願投稿,版權歸原作者所有。本站不承擔相應的法律責任。如發現涉嫌抄襲或侵權的內容,請聯絡admin@php.cn
最新下載
更多>
網站特效
網站源碼
網站素材
前端模板
關於我們 免責聲明 Sitemap
PHP中文網:公益線上PHP培訓,幫助PHP學習者快速成長!