

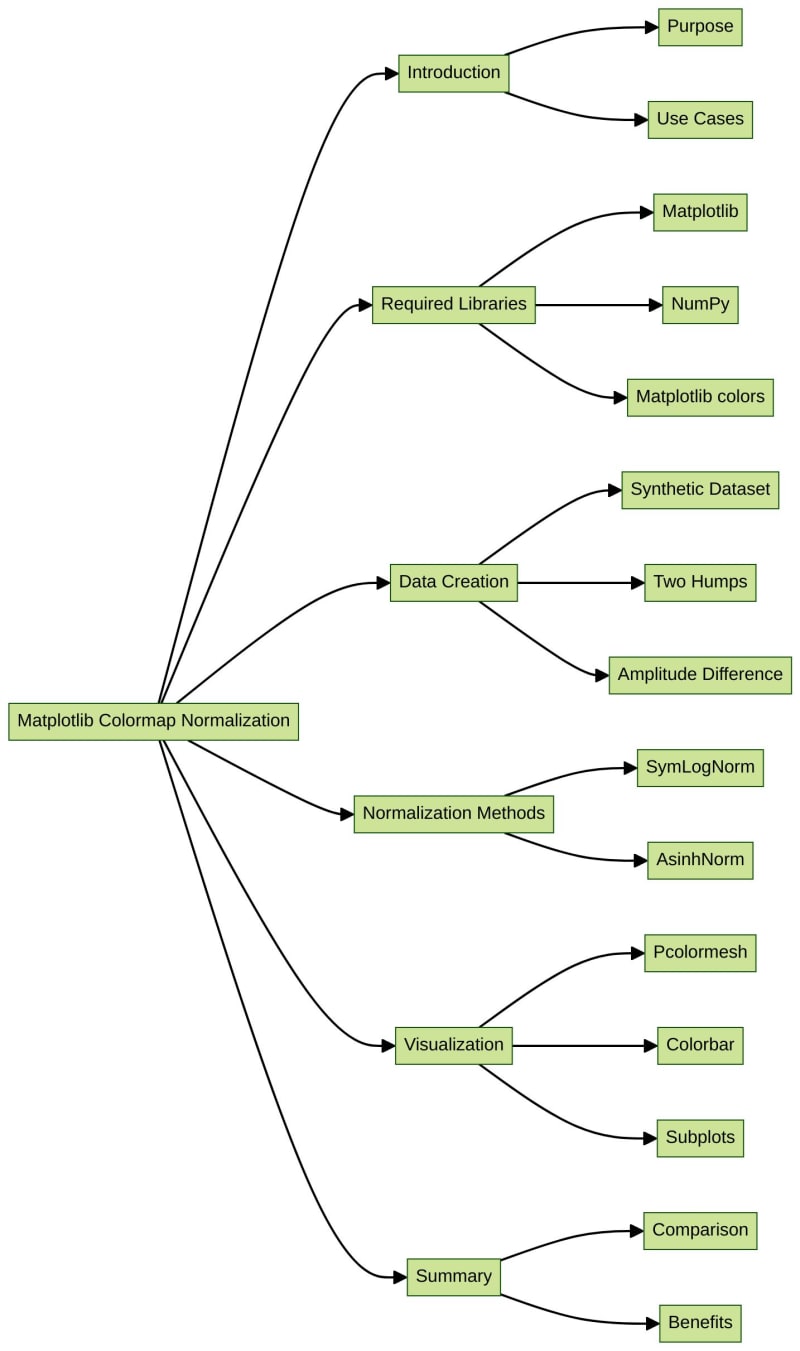
In data visualization, colormaps are used to represent numerical data through color. However, sometimes the data distribution may be nonlinear, which can make it difficult to discern the details of the data. In such cases, colormap normalization can be used to map colormaps onto data in nonlinear ways to help visualize the data more accurately. Matplotlib provides several normalization methods, including SymLogNorm and AsinhNorm, which can be used to normalize colormaps. This lab will demonstrate how to use SymLogNorm and AsinhNorm to map colormaps onto nonlinear data.
After the VM startup is done, click the top left corner to switch to theNotebooktab to access Jupyter Notebook for practice.
Sometimes, you may need to wait a few seconds for Jupyter Notebook to finish loading. The validation of operations cannot be automated because of limitations in Jupyter Notebook.
If you face issues during learning, feel free to ask Labby. Provide feedback after the session, and we will promptly resolve the problem for you.
In this step, we will import the necessary libraries, including Matplotlib, NumPy, and Matplotlib colors.
import matplotlib.pyplot as plt import numpy as np import matplotlib.colors as colors
In this step, we will create a synthetic dataset consisting of two humps, one negative and one positive, with the positive hump having an amplitude eight times greater than the negative hump. We will then apply SymLogNorm to visualize the data.
def rbf(x, y): return 1.0 / (1 + 5 * ((x ** 2) + (y ** 2))) N = 200 gain = 8 X, Y = np.mgrid[-3:3:complex(0, N), -2:2:complex(0, N)] Z1 = rbf(X + 0.5, Y + 0.5) Z2 = rbf(X - 0.5, Y - 0.5) Z = gain * Z1 - Z2 shadeopts = {'cmap': 'PRGn', 'shading': 'gouraud'} colormap = 'PRGn' lnrwidth = 0.5
In this step, we will apply SymLogNorm to the synthetic data and visualize the results.
fig, ax = plt.subplots(2, 1, sharex=True, sharey=True) pcm = ax[0].pcolormesh(X, Y, Z, norm=colors.SymLogNorm(linthresh=lnrwidth, linscale=1, vmin=-gain, vmax=gain, base=10), **shadeopts) fig.colorbar(pcm, ax=ax[0], extend='both') ax[0].text(-2.5, 1.5, 'symlog') pcm = ax[1].pcolormesh(X, Y, Z, vmin=-gain, vmax=gain, **shadeopts) fig.colorbar(pcm, ax=ax[1], extend='both') ax[1].text(-2.5, 1.5, 'linear') plt.show()
In this step, we will apply AsinhNorm to the synthetic data and visualize the results.
fig, ax = plt.subplots(2, 1, sharex=True, sharey=True) pcm = ax[0].pcolormesh(X, Y, Z, norm=colors.SymLogNorm(linthresh=lnrwidth, linscale=1, vmin=-gain, vmax=gain, base=10), **shadeopts) fig.colorbar(pcm, ax=ax[0], extend='both') ax[0].text(-2.5, 1.5, 'symlog') pcm = ax[1].pcolormesh(X, Y, Z, norm=colors.AsinhNorm(linear_width=lnrwidth, vmin=-gain, vmax=gain), **shadeopts) fig.colorbar(pcm, ax=ax[1], extend='both') ax[1].text(-2.5, 1.5, 'asinh') plt.show()
In this lab, we learned how to use SymLogNorm and AsinhNorm to map colormaps onto nonlinear data. By applying these normalization methods, we can visualize the data more accurately and discern the details of the data more easily.
? Practice Now: Matplotlib Colormap Normalization
以上是Matplotlib Colormap Normalization: Visualizing Nonlinear Data的詳細內容。更多資訊請關注PHP中文網其他相關文章!


