

1. How to obtain the series in echarts that is combined into a histogram based on the data of the json file?
2. The following is json data: {
{
"info": {
"userCount": 906,
"have_num": 693,
"pass_num": 417,
"unpass_num": 276,
"pass_rate": "60.17%",
"make_have": 357,
"make_pass": 336,
"make_unpass": 21,
"make_rate": "94.12%"
},
"item": [
{
  "PlaceName": "朔州市安全考试中心",
  "Detail": [
    {
      "Name": "低压电工作业",
      "Num": 433,
      "Pass": 372,
      "Fail": 23,
      "Miss": 38
    },
    {
      "Name": "高压电工作业",
      "Num": 283,
      "Pass": 252,
      "Fail": 25,
      "Miss": 6
    },
    {
      "Name": "熔化焊接与热切割作业",
      "Num": 178,
      "Pass": 131,
      "Fail": 4,
      "Miss": 43
    }
  ]
},
{
  "PlaceName": "朔州考点2测试",
  "Detail": [
    {
      "Name": "低压电工作业",
      "Num": 4,
      "Pass": 1,
      "Fail": 2,
      "Miss": 1
    }
  ]
},
{
  "PlaceName": "朔州考点3测试",
  "Detail": [
    {
      "Name": "高压电工作业",
      "Num": 4,
      "Pass": 0,
      "Fail": 0,
      "Miss": 4
    },
    {
      "Name": "熔化焊接与热切割作业",
      "Num": 4,
      "Pass": 0,
      "Fail": 0,
      "Miss": 4
    }
  ]
}
]
}
3. The following is an example of the histogram that needs to be made: 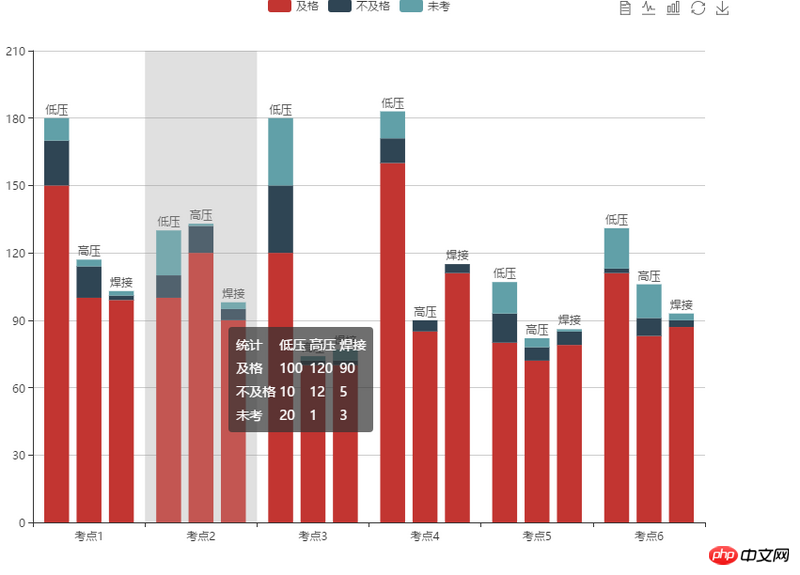
4. Sample code:
<!DOCTYPE html>
<html lang="en">
<head>
<meta charset="UTF-8">
<title>echarts</title>
<script src="echarts/echarts.js"></script>
<script src="jquery/jquery-1.11.0.min.js"></script>
<!--<script src="echarts/theme/macarons.js"></script>-->
</head>
<body>
<p>
</p>
<p id="main" style="width: 800px;height: 600px;"></p>
<script type="text/javascript">
var myChart=echarts.init(document.getElementById('main'));
var bcBySeriesIndex = ['low voltage', 'low voltage', 'low voltage',
    '高压', '高压', '高压', '焊接', '焊接', '焊接'
];

   var option= {
// title: {
// text: 'Statistical Chart of Examination Situation at Test Centers on April 6, 2017'
// },
       toolbox: {
           show: true,
           feature: {
               dataView: {
                   show: true,
                   readOnly: false
               },
               magicType: {
                   show: true,
                   type: ['line', 'bar']
               },
               restore: {
                   show: true
               },
               saveAsImage: {
                   show: true
               }
           }
       },
       calculable: true,
       tooltip: {
           trigger: 'axis',
           axisPointer: { // 坐标轴指示器,坐标轴触发有效
               type: 'shadow' // 默认为直线,可选为:'line' | 'shadow'
           },
           formatter: function(params) {
               var html = [];
               var category = {};
               echarts.util.each(params, function(param) {
                   var catName = param.seriesName;
                   var bc = bcBySeriesIndex[param.seriesIndex];
                   if (!category[catName]) {
                       category[catName] = {};
                   }
                   category[catName][bc] = param.value;
               });
// console.log(category);
               echarts.util.each(category, function(cate, key) {
                   html.push(
                           '<tr>',
                           '<td>', key, '</td>',
                           '<td>', cate.低压, '</td>',
                           '<td>', cate.高压, '</td>',
                           '<td>', cate.焊接, '</td>',
                           '</tr>'
                   );
               });

               return '<table border=0><tbody>' +
                       '<tr><td>统计</td><td>低压</td><td>高压</td><td>焊接</td></tr>' +
                       html.join('') +
                       '</tbody></table>';
           }
       },
       legend: {
           data: [
               '及格', '不及格', '未考'
           ],
           x: 'center'
       },
       grid: {
           left: '3%',
           right: '4%',
           bottom: '3%',
           containLabel: true
       },
       xAxis: [{
           type: 'category',
           data: ['考点1', '考点2', '考点3', '考点4', '考点5', '考点6']
       }],
       yAxis: [{
           type: 'value'
       }],
       series: [
           {
           name: '及格',
           type: 'bar',
           stack: '低压',
           data: [150, 100, 120, 160, 80, 111]
           }, {
           name: '不及格',
           type: 'bar',
           stack: '低压',
           data: [20, 10, 30, 11, 13, 2]
           }, {
           name: '未考',
           type: 'bar',
           stack: '低压',
           data: [10, 20, 30, 12, 14, 18],
           label: {
               normal: {
                   show: true,
                   position: 'top',
                   formatter: '低压',
                   textStyle: {
                       color: '#333'
                   }
               }
           }

           },
           {
               name: '及格',
               type: 'bar',
               stack: '高压',
               data: [100, 120, 70, 85, 72, 83]
           }, {
               name: '不及格',
               type: 'bar',
               stack: '高压',
               data: [14, 12, 2, 5, 6, 8]
           }, {
               name: '未考',
               type: 'bar',
               stack: '高压',
               data: [3, 1, 2, 0, 4, 15, 10],
               label: {
                   normal: {
                       show: true,
                       position: 'top',
                       formatter: '高压',
                       textStyle: {
                           color: '#333'
                       }
                   }
               }
           },

           {
               name: '及格',
               type: 'bar',
               stack: '焊接',
               data: [99, 90, 70, 111, 79, 87]
           }, {
               name: '不及格',
               type: 'bar',
               stack: '焊接',
               data: [2, 5, 2, 4, 6, 3]
           }, {
               name: '未考',
               type: 'bar',
               stack: '焊接',
               data: [2, 3, 5, 0, 1, 3],
               label: {
                   normal: {
                       show: true,
                       position: 'top',
                       formatter: '焊接',
                       textStyle: {
                           color: '#333'
                       }
                   }
               }
           }
       ]
   };
   myChart.setOption(option);
</script>
</body>
</html>
5. How to replace the data in the example with the data of the json file?


![[Web front-end] Node.js quick start](https://img.php.cn/upload/course/000/000/067/662b5d34ba7c0227.png)


Documentation
Isn’t it very clear here