
Course Intermediate 3821
Course Introduction:The data visualization project uses the most popular chart engine ECharts to display all aspects of data that need to be presented in the e-commerce platform. Used to analyze the operation of e-commerce platforms in more detail in order to make correct decisions. The front-end of this project uses the Vue technology stack, the back-end uses the Koa2 framework, and the front-end and back-end data interaction uses WebSocket to ensure the real-time nature of the data. The project also supports theme switching to display cool chart effects. It also supports switching between large and small screens, ensuring that charts are presented on different screens.

Course Intermediate 11340
Course Introduction:"Self-study IT Network Linux Load Balancing Video Tutorial" mainly implements Linux load balancing by performing script operations on web, lvs and Linux under nagin.

Course Advanced 17646
Course Introduction:"Shangxuetang MySQL Video Tutorial" introduces you to the process from installing to using the MySQL database, and introduces the specific operations of each link in detail.
Integration with built-in charts and Google Charts using PrimeReact
2023-09-06 14:54:13 0 1 674
Create multiple brush charts using VueJs and Apexcharts
2023-08-26 20:17:05 0 1 570
2019-05-29 11:47:49 0 2 1326
2018-11-12 14:26:37 0 6 1686
How to add images to a JavaScript quiz application
2024-02-03 20:47:02 0 1 395

Course Introduction:With the development of the Internet, data visualization has become an increasingly important skill. On websites or applications, data can be displayed more intuitively through charts, making it easier for users to understand. In PHP development, there are many chart libraries to choose from. This article will introduce some commonly used PHP chart libraries and their applications. GoogleChartsGoogleCharts is a free chart library provided by Google that supports multiple types of charts, such as line charts, bar charts, pie charts, etc. GoogleCharts by J
2023-06-23 comment 0 1095

Course Introduction:HTML5 Canvas chart application Chart.js custom prompt line chart
2016-11-04 comment 0 1853
Course Introduction:When it comes to chart applications, web charts made with HTML5 and jQuery are more convenient and usable, and they are more flexible to customize in terms of function and appearance. This article will share with you 9 classic and gorgeous HTML5 chart applications. It may be helpful to your front-end development. Let’s take a look.
2018-03-21 comment 0 2990
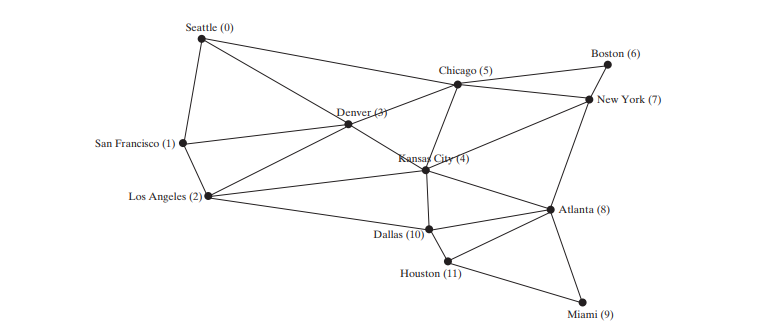
Course Introduction:Many real-world problems can be solved using graph algorithms. Graphs are useful in modeling and solving real-world problems. For example, the problem to find the least number of flights between two cities can be modeled using a graph, where the vert
2024-08-09 comment 0 588
Course Introduction:Express.js is a powerful tool for creating server-side applications, and CanvasJS makes it easy to visualize data with interactive charts. This tutorial will show you how to integrate the two for a seamless charting experience in your Express.js appl
2024-12-03 comment 0 411