Course Intermediate 11273
Course Introduction:"Self-study IT Network Linux Load Balancing Video Tutorial" mainly implements Linux load balancing by performing script operations on web, lvs and Linux under nagin.

Course Advanced 17598
Course Introduction:"Shangxuetang MySQL Video Tutorial" introduces you to the process from installing to using the MySQL database, and introduces the specific operations of each link in detail.

Course Advanced 11309
Course Introduction:"Brothers Band Front-end Example Display Video Tutorial" introduces examples of HTML5 and CSS3 technologies to everyone, so that everyone can become more proficient in using HTML5 and CSS3.
How to make a stacked donut (pie) chart in Vue.js using Highcharts?
2024-03-19 19:17:54 0 1 505
javascript - How to modify Baidu echarts chart
2017-07-05 11:08:59 0 3 1358
React .map not working when trying to set data for display on chart
2023-08-17 11:56:29 0 1 533
Looking for help: How to permanently display data labels on a chart consistent with their position
2023-08-15 23:21:18 0 1 516
How to put text into donut chart using react-chartjs-2.js?
2024-03-30 15:14:29 0 1 490

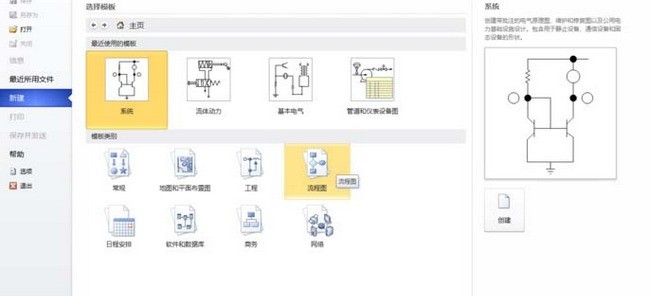
Course Introduction:We need to open the Microsoft Office Visio software first, then we click the [File] menu, then select [New], then click [Flowchart], then in the [Flowchart] interface, select [BPMN Diagram], and click [Create] on the right. We enter the drawing interface of [BPMN Diagram] and use the mouse to click and hold the object in [BPMN Basic Shape] on the left, and drag it to the main window on the right. Then we use the mouse to click and hold the object in [BPMN Event] on the left , and drag it to the main window on the right
2024-06-01 comment 0 559