Course Intermediate 11340
Course Introduction:"Self-study IT Network Linux Load Balancing Video Tutorial" mainly implements Linux load balancing by performing script operations on web, lvs and Linux under nagin.

Course Advanced 17643
Course Introduction:"Shangxuetang MySQL Video Tutorial" introduces you to the process from installing to using the MySQL database, and introduces the specific operations of each link in detail.

Course Advanced 11353
Course Introduction:"Brothers Band Front-end Example Display Video Tutorial" introduces examples of HTML5 and CSS3 technologies to everyone, so that everyone can become more proficient in using HTML5 and CSS3.
How to load random icons every time React loads
2023-09-09 14:48:46 0 1 752
Place interactive markers on images using React
2023-09-08 21:25:41 0 1 844
How to remove white space around icons in CSS FLEXBOX?
2023-08-10 14:11:39 0 1 478
2017-05-18 10:46:56 0 2 723
How to create a hybrid straight/curved section boundary using svg or css?
2023-09-02 11:35:13 0 1 626

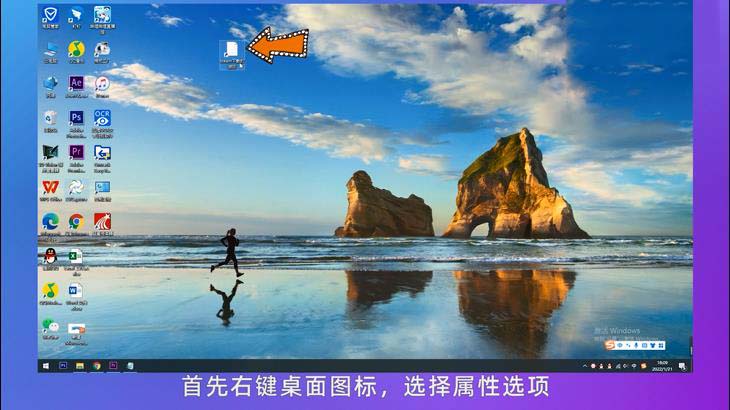
Course Introduction:The steam gaming platform is a gaming tool used by many users, but many users say that the desktop icons of games downloaded from steam are white, so what should I do? Next, let this site carefully introduce to users the analysis of the problem that the desktop icon of the game downloaded from Steam is white. Analysis of the problem that the desktop icon of the game downloaded from steam is white 1. First, right-click the desktop icon and select the properties option. 2. Then click the change icon and select browsing options. 3. Then find the downloaded game and click the Open button. 4. Finally, click the OK button twice.
2024-08-28 comment 0 1127

Course Introduction:How to Customize Bullet Colors in HTML Lists without Using Images or Span TagsThe ChallengeWhen customizing an unsorted HTML list with square...
2024-12-10 comment 0 798

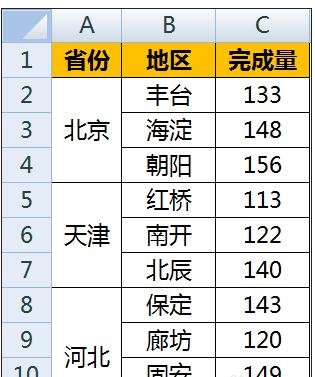
Course Introduction:As shown in the figure, it is the original data. Column A is the name of the province and city, column B is the lower-level address, and column C is the mapping data. Insert a blank row between the two first-level addresses in column A, so that the graphics in the two areas in the chart are separated and not connected together. Select all data areas and select [Insert]-[Chart]-[Area Chart]. The default generated chart style is as follows. The data in column C is displayed in blue as a series: Copy the data in column C of the original area, right-click the mouse in the chart area, and select [Paste]. In this way, a new red graphic series will be added to the chart, coinciding with the original blue area. Select the red series data and change the chart type to a line chart by right-clicking the mouse. Select [Line Chart with Data Markers] in the line chart, and then confirm. So, blue
2024-04-17 comment 0 568

Course Introduction:1. How to remove the blue shadow on the icons on the computer screen? The specific steps to remove the blue shadow on the computer desktop icon are as follows: 1. First turn on the computer, enter the computer desktop, right-click "My Computer" and select "Properties". 2. Then in the properties page, choose to open "Advanced System Settings". 3. Then in the advanced system settings page, choose to open the performance settings in the first advanced. 4. Then deselect "Use shadows for icon labels on the desktop" in the pop-up window and press Enter to confirm. 5. The blue shadow of the computer desktop icon is removed. 2. How to remove the blue shadow on computer desktop icons? You can try the following to remove the blue shadow: 1. Right-click an empty space on the desktop and select "Personalize". 2. Select “Main
2024-08-19 comment 0 864

Course Introduction:1. Open the Edraw flow chart making software and follow this operation [New--->Project Management--->Relationship Matrix], as shown in the figure: 2. Click the [Create] operation to create a blank canvas and view the basic elements, as shown in the figure :3. Find [Relationship Matrix-Vertical Title] in the [Relationship Matrix] menu bar and drag one to the canvas, as shown in the figure: 4. Modify the first row and column of the relationship matrix and set them to displayable content, such as Figure: 5. Corresponding to the rows and columns, add small icons in the square grid. Icons can be added according to the project progress, as shown in Figure: 6. Select [Relationship Matrix] and set the fill color [Single Color Gradient Fill] to blue, as shown in the Figure:
2024-04-08 comment 0 801