

Course 3739
Course Introduction:There are two main purposes for studying this course: 1. Visual panel layout adapts to the screen 2. Use ECharts to realize histogram display Core Technology: -Based on flexible.js + rem smart large screen adaptation - VScode cssrem plug-in - Flex layout - Less to use - Based on ECharts data visualization display - ECharts histogram data settings - ECharts map introduction

Course 19661
Course Introduction:Use PDO mode (PHP data object) to connect and select databases (unified operation of various databases), execute SQL statements and process result sets

Course 1681
Course Introduction:Python visualization video series using matplotlib, seaborn, pyecharts, combined with real data sets; this video is reproduced from Bilibili: BV1gz411v7F5

Course 7440
Course Introduction:Many programmers who have worked for many years still have a very basic understanding of databases. They are confused as soon as they go out for interviews. They don’t understand basic SQL statements, more complex SQL queries, and SQL statement optimization. They don’t even know how to use them. Redis improves system performance and can withstand tens of millions of concurrencies. This set of courses will help you thoroughly understand MySQL locks, execution plans, indexes, MVCC & Redis transactions, cache, breakdown, penetration, avalanche, warm-up, etc., and you can complete all database interviews in one set!

Course 3390
Course Introduction:PHP and MySQL database are golden partners. Not only are they free to use, but more importantly, MySQL can be better combined with PHP. PHP also provides a dedicated programming interface for the MySQL database, improving development efficiency.
How to list data in a section by ID using while loop in PHP?
2023-11-17 20:03:03 0 1 290
How to make table cell values hyperlinked in Dash? (Using Plotly, Dash, Pandas, etc.)
2023-11-17 18:47:10 0 1 283
Best way to preload route data before accessing the route.
2023-11-17 14:54:42 0 2 379
New title: New script does not correctly display strange character encoding of stored data
2023-11-17 10:51:01 0 2 273
Nuxt.js SSG (Static Site Generator) Get API Data
2023-11-16 21:36:07 0 1 176

Course Introduction:鸣潮游戏中有不少的小伙伴还不知道怎么去收集到怨鸟泽旧数据集,那么古今多少故事怨鸟泽旧数据集在哪呢?下面是小编给大家带来的《鸣潮》古今多少故事怨鸟泽旧数据集收集攻略,感兴趣的小伙伴们一起来看看吧。鸣潮古今多少故事怨鸟泽旧数据集收集攻略1、传送到图下标记好的位置,在此进行收集。2、到达目的地之后,就能看到这箱子进行调查即可。3、继续传送到图下的锚点,进行调查之后,收集到第二份数据。4、来到这个位置之后,在这个木箱子进行调查就能收集到全部都数据了。
2024-06-05 comment 0 980

Course Introduction:Webmasters and operators often use website data analysis tools. Google Analytics, Baidu Statistics, Tencent Analytics, etc. are widely used. If you want to collect statistics, you must first collect data. Let’s analyze the principles of data collection and build a data collection system. system. Data collection principle analysis To put it simply, the website statistical analysis tool needs to collect the user's behavior of browsing the target website (such as opening a certain web page, clicking a certain button, adding products to the shopping cart, etc.) and additional behavioral data (such as the behavior generated by an order). order amount, etc.). Early website statistics often collected only one user behavior: the opening of a page. Then the user's behavior on the page cannot be collected. This collection strategy can meet common analysis perspectives such as basic traffic analysis, source analysis, content analysis and visitor attributes.
2023-05-28 comment 0 499
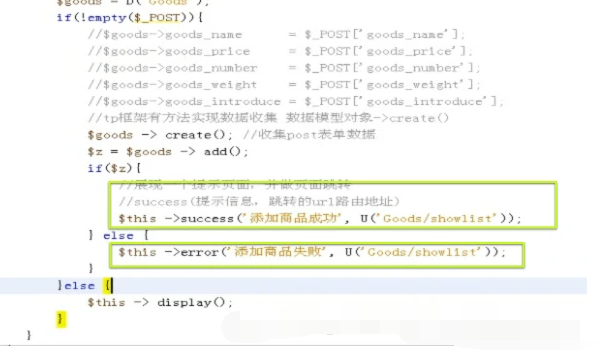
Course Introduction:This article will use the thinkphp tutorial column to introduce three ways for ThinkPHP to collect form data and store it into the database. I hope it will be helpful to friends in need!
2021-08-19 comment 0 2203

Course Introduction:鸣潮虎口山脉,蕴藏着神秘而壮丽的自然风光,一直是探险家们的热门目的地。然而,对于这片山脉的旧数据集的收集位置,我们仍然需要更多的信息。让我们一同踏上这段探索之旅,探寻那些被岁月遗忘的珍贵数据,为历史留下更完整的记忆。*任务一共三个旧数据集,都捡到以后才会触发任务,完成任务以后会获得一本《奇怪的通讯》和经典时尚小垃圾若干(没有星声)【第一个位置】第一个在集散中心上方,参照点是野猪的红名怪刷新地(如图)。顺着野猪的土路走就可以看到一个石柱,调查点在石柱上。
2024-06-14 comment 752
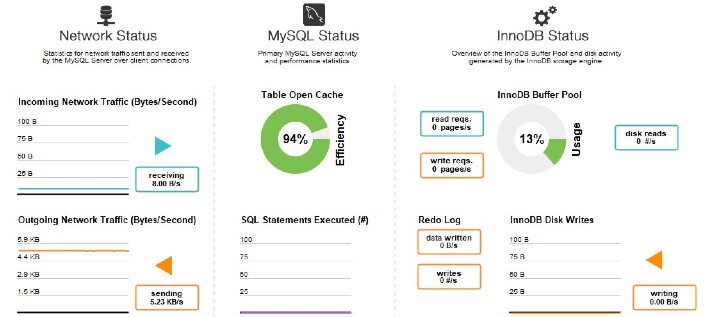
Course Introduction:In this article, we will learn how to collect Mysql statistics and metrics. Performance Dashboard View statistics about server performance in the dashboard. Open the Query tab, select the Administration tab, and click Dashboards in the Performance section of the Navigator sidebar to display the dashboard. The following figure describes the information structure of the "Admin - Dashboard" tab. Performance: Dashboard Network Status This displays network traffic data transmitted and received by the MySQL server through client connections. Incoming network traffic, outgoing network traffic, and client connections are all examples of data points. MySQL Status This displays key performance and activity metrics for the MySQL server. Data items include table opening cache validity, number of SQL statements executed, and SELECT and INSER
2023-08-27 comment 0 1108